Napa Auto Parts 2015 Annual Report Download - page 49
Download and view the complete annual report
Please find page 49 of the 2015 Napa Auto Parts annual report below. You can navigate through the pages in the report by either clicking on the pages listed below, or by using the keyword search tool below to find specific information within the annual report.-
 1
1 -
2
-
3
-
4
-
5
-
6
-
7
-
8
-
9
-
10
-
11
-
12
-
13
-
14
-
15
-
16
-
17
-
18
-
19
-
20
-
21
-
22
-
23
-
24
-
25
-
26
-
27
-
28
-
29
-
30
-
31
-
32
-
33
-
34
-
35
-
36
-
37
-
38
-
 39
39 -
 40
40 -
 41
41 -
 42
42 -
 43
43 -
 44
44 -
 45
45 -
 46
46 -
 47
47 -
 48
48 -
 49
49 -
 50
50 -
 51
51 -
 52
52 -
 53
53 -
 54
54 -
 55
55 -
 56
56 -
 57
57 -
 58
58 -
 59
59 -
60
-
61
-
62
-
63
-
64
-
65
-
66
-
67
-
68
-
69
-
70
-
71
-
72
-
73
-
74
-
75
-
76
-
77
-
78
-
79
-
80
-
81
-
82
-
83
-
84
-
85
-
86
-
87
-
88
-
89
-
90
-
91
 |
 |

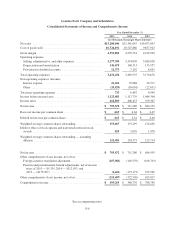
Genuine Parts Company and Subsidiaries
Consolidated Statements of Income and Comprehensive Income
Year Ended December 31
2015 2014 2013
(In Thousands, Except per Share Amounts)
Net sales ............................................... $15,280,044 $15,341,647 $14,077,843
Cost of goods sold ........................................ 10,724,192 10,747,886 9,857,923
Gross margin ............................................ 4,555,852 4,593,761 4,219,920
Operating expenses:
Selling, administrative, and other expenses .................. 3,277,390 3,314,030 3,028,028
Depreciation and amortization ............................ 141,675 148,313 133,957
Provision for doubtful accounts ........................... 12,373 7,192 8,691
Total operating expenses ................................... 3,431,438 3,469,535 3,170,676
Non-operating expenses (income):
Interest expense ........................................ 21,662 25,088 26,971
Other ................................................ (20,929) (18,601) (22,031)
Total non-operating expenses ............................... 733 6,487 4,940
Income before income taxes ................................ 1,123,681 1,117,739 1,044,304
Income taxes ............................................ 418,009 406,453 359,345
Net income ............................................. $ 705,672 $ 711,286 $ 684,959
Basic net income per common share .......................... $ 4.65 $ 4.64 $ 4.43
Diluted net income per common share ........................ $ 4.63 $ 4.61 $ 4.40
Weighted average common shares outstanding ................. 151,667 153,299 154,636
Dilutive effect of stock options and nonvested restricted stock
awards ............................................... 829 1,076 1,078
Weighted average common shares outstanding — assuming
dilution .............................................. 152,496 154,375 155,714
Net income ............................................. $ 705,672 $ 711,286 $ 684,959
Other comprehensive (loss) income, net of tax:
Foreign currency translation adjustment ..................... (207,986) (149,379) (168,703)
Pension and postretirement benefit adjustments, net of income
taxes of 2015 — $5,335, 2014 — $112,993, and
2013 — ($175,297) ................................... (2,421) (173,177) 272,540
Other comprehensive (loss) income, net of tax .................. (210,407) (322,556) 103,837
Comprehensive income .................................... $ 495,265 $ 388,730 $ 788,796
See accompanying notes.
F-6