Napa Auto Parts 2015 Annual Report Download - page 26
Download and view the complete annual report
Please find page 26 of the 2015 Napa Auto Parts annual report below. You can navigate through the pages in the report by either clicking on the pages listed below, or by using the keyword search tool below to find specific information within the annual report.-
 1
1 -
2
-
3
-
4
-
5
-
6
-
7
-
8
-
9
-
10
-
11
-
12
-
13
-
14
-
15
-
 16
16 -
 17
17 -
 18
18 -
 19
19 -
 20
20 -
 21
21 -
 22
22 -
 23
23 -
 24
24 -
 25
25 -
 26
26 -
 27
27 -
 28
28 -
 29
29 -
 30
30 -
 31
31 -
 32
32 -
 33
33 -
 34
34 -
 35
35 -
 36
36 -
37
-
38
-
39
-
40
-
41
-
42
-
43
-
44
-
45
-
46
-
47
-
48
-
49
-
50
-
51
-
52
-
53
-
54
-
55
-
56
-
57
-
58
-
59
-
60
-
61
-
62
-
63
-
64
-
65
-
66
-
67
-
68
-
69
-
70
-
71
-
72
-
73
-
74
-
75
-
76
-
77
-
78
-
79
-
80
-
81
-
82
-
83
-
84
-
85
-
86
-
87
-
88
-
89
-
90
-
91
 |
 |
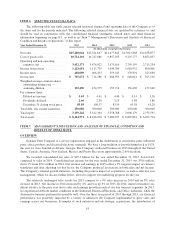
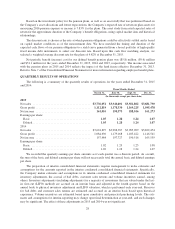
acquisitions. These increases were offset by a 2% negative impact of currency associated with our automotive
businesses in Canada, Australasia and Mexico. Automotive sales were not materially impacted by product
inflation. In 2014, Automotive revenues were up 23% in the first quarter, up 5% in the second quarter and up 4%
in the third and fourth quarters. The first quarter sales increase includes the impact of the GPC Asia Pacific
acquisition, which was anniversaried on April 1, 2014.
Industrial Group
Net sales for Motion Industries, our Industrial Group (“Industrial”), were $4.6 billion in 2015, a 3%
decrease from 2014. Sales volumes in Industrial were down approximately 4% from the prior year, while a 1%
negative impact of currency associated with our Canadian and Mexican operations also contributed to the decline
in sales. These items were partially offset by higher transaction values associated with product inflation, which
added an approximate 1% to sales, and 1% in sales from acquisitions. Industrial revenues were up 3% in the first
quarter of 2015, down 2% in the second quarter, down 4% in the third quarter and down 7.5% in the fourth quar-
ter. The manufacturing indices we track in this group progressively weakened throughout 2015, which correlates
to lower demand among our customer base and, in particular, those customers dependent on exports as well as
the oil and gas sector. We expect the tough industrial economy to persist well into 2016, although we do have
multiple initiatives in place to help us grow our market share and overcome these challenges.
Net sales for Industrial were $4.8 billion in 2014, an increase of 8% from 2013. Sales volumes in Industrial
were up approximately 4.5% from the prior year, while higher transaction values associated with product
inflation added 1.5% and acquisitions contributed approximately 3% to sales in 2014. These items were offset by
a 1% negative impact of currency associated with our Canadian business. Industrial revenues were up 4% in the
first quarter of 2014, up 7% in the second quarter and up 10% in the third and fourth quarters.
Office Group
Net sales for S. P. Richards, our Office Products Group (“Office”), were $1.9 billion in 2015, an increase of
7.5% from 2014. The increase in sales reflects an approximate 4% increase in sales volume, a 0.6% increase in
higher transaction values associated with price inflation and a 3% contribution from acquisitions. These items
were offset by an approximate 0.5% negative impact of currency associated with our Canadian operations. In
2015, Office experienced relatively stable industry conditions, as evidenced by the steady growth in new jobs
throughout the year. These conditions combined with new business from a primary customer, which anni-
versaried on July 1, 2015, served to drive the increase in sales volume for the year. Sales were up 17% in the first
quarter, up 14% in the second quarter, up 3% in the third quarter and down 2% in the fourth quarter of 2015. We
will continue to focus on our growth initiatives, including the ongoing diversification of product and customer
portfolios, market share gains and acquisitions to further improve the Office business in 2016.
Net sales for Office were $1.8 billion in 2014, an increase of 10% from 2013. The increase in sales reflects a
4% increase in sales volume, a 1.4% increase in higher transaction values associated with price inflation and a
5% contribution from acquisitions. These items were offset by the slight negative impact of currency associated
with our Canadian operations. In 2014, Office experienced improving industry conditions, as evidenced by con-
sistently stronger new jobs reports relative to 2013 as well as a strengthening U.S. GDP. These conditions com-
bined with new business with a primary customer, effective July 1, 2014, served to drive the increased sales
volume for the year. Sales were unchanged in the first quarter, up 4% in the second quarter, up 15% in the third
quarter and up 22% in the fourth quarter of 2014.
Electrical/Electronic Group
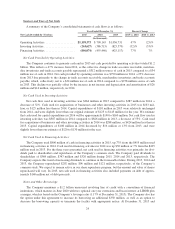
Net sales for EIS, our Electrical and Electronic Group (“Electrical/Electronic”), were $751 million in 2015,
an increase of 1.5% from 2014. The increase in sales consists of a 5% contribution from acquisitions, offset by a
1.7% headwind from lower transaction values associated with price deflation, a 1% negative sales impact of
copper pricing and a 1% decrease in sales volume. Sales for Electrical/Electronic increased by 1% in the first
quarter, 4% in the second quarter, 2% in the third quarter and were unchanged in the fourth quarter, relative to
20