Napa Auto Parts 2015 Annual Report Download - page 74
Download and view the complete annual report
Please find page 74 of the 2015 Napa Auto Parts annual report below. You can navigate through the pages in the report by either clicking on the pages listed below, or by using the keyword search tool below to find specific information within the annual report.-
 1
1 -
2
-
3
-
4
-
5
-
6
-
7
-
8
-
9
-
10
-
11
-
12
-
13
-
14
-
15
-
16
-
17
-
18
-
19
-
20
-
21
-
22
-
23
-
24
-
25
-
26
-
27
-
28
-
29
-
30
-
31
-
32
-
33
-
34
-
35
-
36
-
37
-
38
-
39
-
40
-
41
-
42
-
43
-
44
-
45
-
46
-
47
-
48
-
49
-
50
-
51
-
52
-
53
-
54
-
55
-
56
-
57
-
58
-
59
-
60
-
61
-
62
-
63
-
 64
64 -
 65
65 -
 66
66 -
 67
67 -
 68
68 -
 69
69 -
 70
70 -
 71
71 -
 72
72 -
 73
73 -
 74
74 -
 75
75 -
 76
76 -
 77
77 -
 78
78 -
 79
79 -
 80
80 -
 81
81 -
 82
82 -
 83
83 -
 84
84 -
85
-
86
-
87
-
88
-
89
-
90
-
91
 |
 |

Genuine Parts Company and Subsidiaries
Notes to Consolidated Financial Statements — (Continued)
December 31, 2015
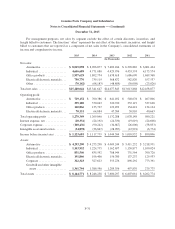
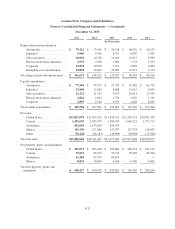
For management purposes, net sales by segment exclude the effect of certain discounts, incentives, and
freight billed to customers. The line item “other” represents the net effect of the discounts, incentives, and freight
billed to customers that are reported as a component of net sales in the Company’s consolidated statements of
income and comprehensive income.
2015 2014 2013 2012 2011
(In Thousands)
Net sales:
Automotive ................. $ 8,015,098 $ 8,096,877 $ 7,489,186 $ 6,320,882 $ 6,061,424
Industrial ................... 4,646,689 4,771,080 4,429,976 4,453,574 4,173,574
Office products .............. 1,937,629 1,802,754 1,638,618 1,686,690 1,689,368
Electrical/electronic materials . . . 750,770 739,119 568,872 582,820 557,537
Other ...................... (70,142) (68,183) (48,809) (30,098) (23,026)
Total net sales ................... $15,280,044 $15,341,647 $14,077,843 $13,013,868 $12,458,877
Operating profit:
Automotive ................. $ 729,152 $ 700,386 $ 641,492 $ 540,678 $ 467,806
Industrial ................... 339,180 370,043 320,720 352,119 337,628
Office products .............. 140,866 133,727 122,492 134,441 134,124
Electrical/electronic materials . . . 70,151 64,884 47,584 50,910 40,663
Total operating profit ............. 1,279,349 1,269,040 1,132,288 1,078,148 980,221
Interest expense, net .............. (20,354) (24,192) (24,330) (19,619) (24,608)
Corporate expense ................ (100,436) (90,242) (34,667) (26,606) (58,033)
Intangible asset amortization ........ (34,878) (36,867) (28,987) (12,991) (6,774)
Income before income taxes ........ $ 1,123,681 $ 1,117,739 $ 1,044,304 $ 1,018,932 $ 890,806
Assets:
Automotive ................. $ 4,293,290 $ 4,275,298 $ 4,009,244 $ 3,411,252 $ 3,218,931
Industrial ................... 1,143,952 1,224,735 1,162,697 1,130,877 1,100,024
Office products .............. 831,546 835,592 708,944 731,564 700,720
Electrical/electronic materials . . . 191,866 196,400 156,780 137,237 129,933
Corporate ................... 322,323 327,623 353,276 898,292 773,391
Goodwill and other intangible
assets .................... 1,361,794 1,386,590 1,289,356 497,839 279,775
Total assets ..................... $ 8,144,771 $ 8,246,238 $ 7,680,297 $ 6,807,061 $ 6,202,774
F-31