Napa Auto Parts 2015 Annual Report Download - page 51
Download and view the complete annual report
Please find page 51 of the 2015 Napa Auto Parts annual report below. You can navigate through the pages in the report by either clicking on the pages listed below, or by using the keyword search tool below to find specific information within the annual report.-
 1
1 -
2
-
3
-
4
-
5
-
6
-
7
-
8
-
9
-
10
-
11
-
12
-
13
-
14
-
15
-
16
-
17
-
18
-
19
-
20
-
21
-
22
-
23
-
24
-
25
-
26
-
27
-
28
-
29
-
30
-
31
-
32
-
33
-
34
-
35
-
36
-
37
-
38
-
39
-
40
-
 41
41 -
 42
42 -
 43
43 -
 44
44 -
 45
45 -
 46
46 -
 47
47 -
 48
48 -
 49
49 -
 50
50 -
 51
51 -
 52
52 -
 53
53 -
 54
54 -
 55
55 -
 56
56 -
 57
57 -
 58
58 -
 59
59 -
 60
60 -
 61
61 -
62
-
63
-
64
-
65
-
66
-
67
-
68
-
69
-
70
-
71
-
72
-
73
-
74
-
75
-
76
-
77
-
78
-
79
-
80
-
81
-
82
-
83
-
84
-
85
-
86
-
87
-
88
-
89
-
90
-
91
 |
 |

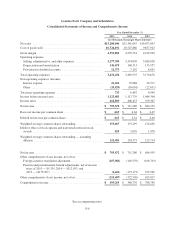
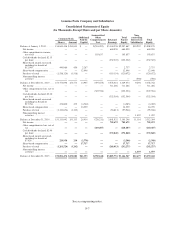
Genuine Parts Company and Subsidiaries
Consolidated Statements of Cash Flows
Year Ended December 31
2015 2014 2013
(In Thousands)
Operating activities
Net income .............................................. $ 705,672 $ 711,286 $ 684,959
Adjustments to reconcile net income to net cash provided by
operating activities:
Depreciation and amortization ........................... 141,675 148,313 133,957
Excess tax benefits from share-based compensation .......... (7,024) (17,766) (12,905)
Gain on sale of property, plant, and equipment .............. (3,189) (3,719) (4,729)
Deferred income taxes .................................. 35,544 54,319 (21,622)
Share-based compensation .............................. 17,717 16,239 12,648
Gain on GPC Asia Pacific equity investment ................ —— (59,000)
Changes in operating assets and liabilities:
Trade accounts receivable, net ......................... 1,974 (225,178) (116,080)
Merchandise inventories, net .......................... (21,821) (100,820) (79,253)
Trade accounts payable ............................... 331,419 292,257 473,424
Other short-term assets and liabilities .................... 967 15,616 (14,418)
Other long-term assets and liabilities .................... (43,561) (100,402) 59,750
453,701 78,859 371,772
Net cash provided by operating activities ....................... 1,159,373 790,145 1,056,731
Investing activities
Purchases of property, plant and equipment ..................... (109,544) (107,681) (124,063)
Proceeds from sale of property, plant, and equipment ............. 8,618 8,866 10,657
Acquisition of businesses and other investing activities ............ (162,701) (287,900) (712,173)
Net cash used in investing activities ........................... (263,627) (386,715) (825,579)
Financing activities
Proceeds from debt ........................................ 3,862,224 2,727,924 3,019,931
Payments on debt ......................................... (4,005,191) (2,735,862) (2,995,335)
Share-based awards exercised, net of taxes paid ................. (9,572) (22,051) (15,728)
Excess tax benefits from share-based compensation .............. 7,024 17,766 12,905
Dividends paid ............................................ (368,284) (347,271) (326,217)
Purchase of stock .......................................... (292,275) (95,946) (120,673)
Net cash used in financing activities ........................... (806,074) (455,440) (425,117)
Effect of exchange rate changes on cash ........................ (15,771) (7,153) (12,237)
Net increase (decrease) in cash and cash equivalents .............. 73,901 (59,163) (206,202)
Cash and cash equivalents at beginning of year .................. 137,730 196,893 403,095
Cash and cash equivalents at end of year ....................... $ 211,631 $ 137,730 $ 196,893
Supplemental disclosures of cash flow information
Cash paid during the year for:
Income taxes ........................................... $ 352,153 $ 408,604 $ 342,372
Interest ................................................ $ 23,687 $ 25,155 $ 27,221
See accompanying notes.
F-8