Napa Auto Parts 2015 Annual Report Download - page 67
Download and view the complete annual report
Please find page 67 of the 2015 Napa Auto Parts annual report below. You can navigate through the pages in the report by either clicking on the pages listed below, or by using the keyword search tool below to find specific information within the annual report.-
 1
1 -
2
-
3
-
4
-
5
-
6
-
7
-
8
-
9
-
10
-
11
-
12
-
13
-
14
-
15
-
16
-
17
-
18
-
19
-
20
-
21
-
22
-
23
-
24
-
25
-
26
-
27
-
28
-
29
-
30
-
31
-
32
-
33
-
34
-
35
-
36
-
37
-
38
-
39
-
40
-
41
-
42
-
43
-
44
-
45
-
46
-
47
-
48
-
49
-
50
-
51
-
52
-
53
-
54
-
55
-
56
-
 57
57 -
 58
58 -
 59
59 -
 60
60 -
 61
61 -
 62
62 -
 63
63 -
 64
64 -
 65
65 -
 66
66 -
 67
67 -
 68
68 -
 69
69 -
 70
70 -
 71
71 -
 72
72 -
 73
73 -
 74
74 -
 75
75 -
 76
76 -
 77
77 -
78
-
79
-
80
-
81
-
82
-
83
-
84
-
85
-
86
-
87
-
88
-
89
-
90
-
91
 |
 |

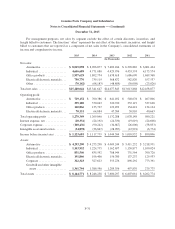
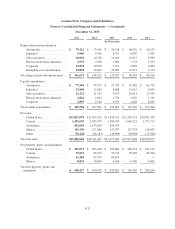
Genuine Parts Company and Subsidiaries
Notes to Consolidated Financial Statements — (Continued)
December 31, 2015
2014
Total
Quoted
Prices
in Active
Markets for
Identical
Assets
(Level 1)
Significant
Observable
Inputs
(Level 2)
Significant
Unobservable
Inputs
(Level 3)
(In Thousands)
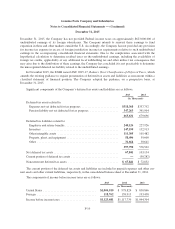
Equity Securities
Common stocks — mutual funds — equity ............. $ 366,716 $ 366,716 $ — $ —
Genuine Parts Company common stock ................ 215,477 215,477 — —
Other stocks ..................................... 822,782 822,782 — —
Debt Securities
Short-term investments ............................. 41,882 41,882 — —
Cash and equivalents .............................. 8,921 8,921 — —
Government bonds ................................ 192,413 96,480 95,933 —
Corporate bonds .................................. 178,214 — 178,214 —
Asset-backed and mortgage–backed securities .......... 27,756 — 27,756 —
Convertible securities .............................. 633 — 633 —
Other-international ................................ 25,137 21,815 3,322 —
Municipal bonds .................................. 6,435 — 6,435 —
Mutual funds — fixed income ....................... 132,752 — 132,752 —
Other
Options and futures ................................ 7 7 — —
Cash surrender value of life insurance policies .......... 2,712 — — 2,712
Total ........................................... $2,021,837 $1,574,080 $445,045 $2,712
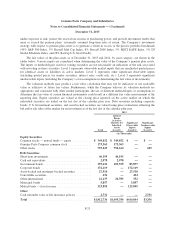
Equity securities include Genuine Parts Company common stock in the amounts of $173,363,000 (9% of
total plan assets) and $215,477,000 (11% of total plan assets) at December 31, 2015 and 2014, respectively.
Dividend payments received by the plan on Company stock totaled approximately $4,965,000 and $4,650,000 in
2015 and 2014, respectively. Fees paid during the year for services rendered by parties in interest were based on
customary and reasonable rates for such services.
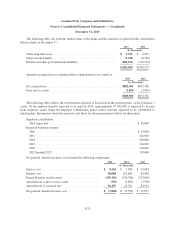
The changes in the fair value measurement of plan assets using significant unobservable inputs (Level 3)
during 2015 and 2014 were not material.
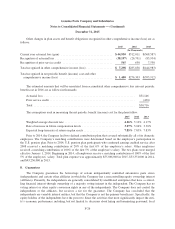
Based on the investment policy for the pension plans, as well as an asset study that was performed based on
the Company’s asset allocations and future expectations, the Company’s expected rate of return on plan assets for
measuring 2016 pension cost or income is 7.83% for the plans. The asset study forecasted expected rates of
return for the approximate duration of the Company’s benefit obligations, using capital market data and historical
relationships.
F-24