Motorola 2011 Annual Report Download - page 98
Download and view the complete annual report
Please find page 98 of the 2011 Motorola annual report below. You can navigate through the pages in the report by either clicking on the pages listed below, or by using the keyword search tool below to find specific information within the annual report.-
 1
1 -
2
-
3
-
4
-
5
-
6
-
7
-
8
-
9
-
10
-
11
-
12
-
13
-
14
-
15
-
16
-
17
-
18
-
19
-
20
-
21
-
22
-
23
-
24
-
25
-
26
-
27
-
28
-
29
-
30
-
31
-
32
-
33
-
34
-
35
-
36
-
37
-
38
-
39
-
40
-
41
-
42
-
43
-
44
-
45
-
46
-
47
-
48
-
49
-
50
-
51
-
52
-
53
-
54
-
55
-
56
-
57
-
58
-
59
-
60
-
61
-
62
-
63
-
64
-
65
-
66
-
67
-
68
-
69
-
70
-
71
-
72
-
73
-
74
-
75
-
76
-
77
-
78
-
79
-
80
-
81
-
82
-
83
-
84
-
85
-
86
-
87
-
 88
88 -
 89
89 -
 90
90 -
 91
91 -
 92
92 -
 93
93 -
 94
94 -
 95
95 -
 96
96 -
 97
97 -
 98
98 -
 99
99 -
 100
100 -
 101
101 -
 102
102 -
 103
103 -
 104
104 -
 105
105 -
 106
106 -
 107
107 -
 108
108 -
109
-
110
-
111
-
112
-
113
-
114
-
115
-
116
-
117
-
118
-
119
-
120
-
121
-
122
-
123
-
124
-
125
-
126
-
127
-
128
-
129
-
130
-
131
 |
 |

92
The risk-free interest rate assumption is based upon the average daily closing rates during the year for U.S.
treasury notes that have a life which approximates the expected life of the option. The dividend yield assumption is
based on the Company’s future expectation of dividend payouts. The expected life of employee stock options
represents the average of the contractual term of the options and the weighted-average vesting period for all option
tranches.
The Company has applied forfeiture rates, estimated based on historical data, of 13%-50% to the option fair
values calculated by the Black-Scholes option pricing model. These estimated forfeiture rates are applied to grants
based on their remaining vesting term and may be revised in subsequent periods if actual forfeitures differ from
these estimates.
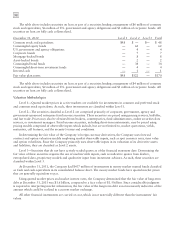
Stock option activity was as follows (in thousands, except exercise price and employee data):
2011 2010 2009
Years Ended December 31
Shares
Subject to
Options
Wtd. Avg.
Exercise
Price
Shares
Subject to
Options
Wtd. Avg.
Exercise
Price
Shares
Subject to
Options
Wtd. Avg.
Exercise
Price
Options outstanding at January 1 19,614 $81 23,061 $ 84 32,592 $120
Options granted 3,155 39 1,630 50 8,939 45
Options exercised (4,475) 27 (1,559) 42 (206) 42
Adjustments to options outstanding to
reflect Mobility spin-off 7,756 39 —— ——
Options terminated, cancelled or expired (10,321) 59 (3,518) 104 (18,264) 128
Options outstanding at December 31 15,729 63 19,614 81 23,061 84
Options exercisable at December 31 11,184 74 12,429 99 11,037 121
Approx. number of employees granted
options 270 529 22,095
At December 31, 2011, the Company had $36 million of total unrecognized compensation expense, net of
estimated forfeitures, related to stock option plans and the employee stock purchase plan that will be recognized
over the weighted average period of approximately two years. Cash received from stock option exercises and the
employee stock purchase plan was $192 million, $179 million and $116 million for the years ended December 31,
2011, 2010 and 2009, respectively. The total intrinsic value of options exercised during the years ended
December 31, 2011, 2010 and 2009 was $73 million, $17 million and $1 million, respectively. The aggregate
intrinsic value for options outstanding and exercisable as of December 31, 2011 was $146 million and $100 million,
respectively, based on a December 31, 2011 stock price of $46.29 per share. Pursuant to the completion of the
Separation on January 4, 2011, approximately 8.0 million stock options were cancelled.
At December 31, 2011 and 2010, 23.7 million shares and 6.6 million shares, respectively, were available for
future share-based award grants under the current share-based compensation plan, covering all equity awards to
employees and non-employee directors.
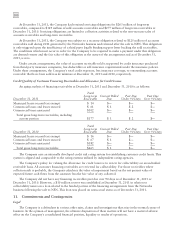
The following table summarizes information about stock options outstanding and exercisable at December 31,
2011 (in thousands, except exercise price and years):
Options Outstanding
Options
Exercisable
Exercise price range
No. of
options
Wtd. avg.
Exercise
Price
Wtd. avg.
contractual
life (in yrs.)
No. of
options
Wtd. avg.
Exercise
Price
Under $30 4,984 $ 26 7 3,752 $ 26
$30-$40 4,641 37 7 2,009 34
$41-$50 747 45 8 176 43
$51-$60 737 55 1 628 54
$61-$70 1,056 68 3 1,055 68
$71-$80 311 74 5 311 74
$81 and over 3,253 161 3 3,253 161
15,729 11,184