Motorola 2011 Annual Report Download - page 10
Download and view the complete annual report
Please find page 10 of the 2011 Motorola annual report below. You can navigate through the pages in the report by either clicking on the pages listed below, or by using the keyword search tool below to find specific information within the annual report.-
 1
1 -
 2
2 -
 3
3 -
 4
4 -
 5
5 -
 6
6 -
 7
7 -
 8
8 -
 9
9 -
 10
10 -
 11
11 -
 12
12 -
 13
13 -
 14
14 -
 15
15 -
 16
16 -
 17
17 -
 18
18 -
 19
19 -
 20
20 -
 21
21 -
22
-
23
-
24
-
25
-
26
-
27
-
28
-
29
-
30
-
31
-
32
-
33
-
34
-
35
-
36
-
37
-
38
-
39
-
40
-
41
-
42
-
43
-
44
-
45
-
46
-
47
-
48
-
49
-
50
-
51
-
52
-
53
-
54
-
55
-
56
-
57
-
58
-
59
-
60
-
61
-
62
-
63
-
64
-
65
-
66
-
67
-
68
-
69
-
70
-
71
-
72
-
73
-
74
-
75
-
76
-
77
-
78
-
79
-
80
-
81
-
82
-
83
-
84
-
85
-
86
-
87
-
88
-
89
-
90
-
91
-
92
-
93
-
94
-
95
-
96
-
97
-
98
-
99
-
100
-
101
-
102
-
103
-
104
-
105
-
106
-
107
-
108
-
109
-
110
-
111
-
112
-
113
-
114
-
115
-
116
-
117
-
118
-
119
-
120
-
121
-
122
-
123
-
124
-
125
-
126
-
127
-
128
-
129
-
130
-
131
 |
 |

4
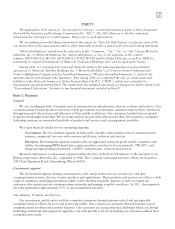
Our Customers
We address the communication and data capture needs of enterprise customers primarily in retail and
hospitality, transportation and logistics, manufacturing, energy and utilities, education and healthcare. These
customers operate a large and diverse mobile workforce and are continuously focused on improving their operations
through greater employee efficiency, greater asset visibility and superior customer service. Our product and services
portfolio delivers attractive return on technology investment for our customers. In addition to serving our existing
customers, we believe that we have opportunities to pursue profitable growth by extending our reach across new
segments and geographies.
Our sales model includes both direct-sales by our in-house sales force and sales through our channel partner
program. Our channel partners include distributors, value added resellers and independent software vendors.
Resellers and distributors each have their own sales organizations that complement and extend the reach of our
sales force. With deep expertise about specific customers’ operations, resellers are very effective in promoting sales
of our product portfolio. The independent software vendors in our channel partner program offer customized
applications, in addition to those that we offer, that meet specific needs in each market we serve. Our Enterprise
segment utilizes our channel partners extensively, as the products of this segment generally support a broad range of
applications. We believe this dual sales approach allows us to meet customer needs effectively, build strong, lasting
relationships and broaden our penetration across segments and geographies.
Our Competition
The segments in which we operate are highly competitive. Continued evolution in our industry and technology
shifts are creating opportunities for established and new competitors. Key competitive factors include product
performance; product features; product quality, availability and warranty; price; availability of vendor financing;
quality and availability of service; company reputation and financial strength; partner community; and relationship
with key customers. Our strong relationships with customers and partners, technology leadership, breadth of
portfolio, product performance and support position us well to provide customized solutions for our customers that
drive our success.
We experience widespread competition from a growing number of existing and new competitors, including
present manufacturers of laser/imager/RFID based data capture devices, optical instruments, notebook computers
and tablets, smart phones, cordless phones, and cellular/WLAN/wired infrastructure equipment. Major competitors
include: Apple, Aruba, Bluebird, Cisco, Datalogic, Honeywell, Hewlett Packard, Intermec, Psion, Panasonic, and
Samsung.
Backlog
Our backlog position at December 31, 2011, was approximately $480 million, compared to $570 million at
December 31, 2010. Our order backlog is believed to be generally firm and only includes received product and
system installation labor orders from customers. Service orders such as maintenance and extended warranty
contracts are excluded from backlog. Approximately 97% of that amount is expected to be recognized as revenue
during 2012. The forward-looking estimate of the firmness of such orders is subject to future events that may cause
the amount recognized to change.
Other Information
Financial Information About Segments
The response to this section of Item 1 incorporates by reference Note 12, “Information by Segment and
Geographic Region,” of Part II, Item 8: Financial Statements and Supplementary Data of this document.
Financial Information About Geographic Areas
The response to this section of Item 1 incorporates by reference Note 11, “Commitments and Contingencies”
and Note 12, “Information by Segment and Geographic Region” of Part II, Item 8: Financial Statements and
Supplementary Data of this document, the “Results of Operations—2011 Compared to 2010” and “Results of