Motorola 2011 Annual Report Download - page 104
Download and view the complete annual report
Please find page 104 of the 2011 Motorola annual report below. You can navigate through the pages in the report by either clicking on the pages listed below, or by using the keyword search tool below to find specific information within the annual report.-
 1
1 -
2
-
3
-
4
-
5
-
6
-
7
-
8
-
9
-
10
-
11
-
12
-
13
-
14
-
15
-
16
-
17
-
18
-
19
-
20
-
21
-
22
-
23
-
24
-
25
-
26
-
27
-
28
-
29
-
30
-
31
-
32
-
33
-
34
-
35
-
36
-
37
-
38
-
39
-
40
-
41
-
42
-
43
-
44
-
45
-
46
-
47
-
48
-
49
-
50
-
51
-
52
-
53
-
54
-
55
-
56
-
57
-
58
-
59
-
60
-
61
-
62
-
63
-
64
-
65
-
66
-
67
-
68
-
69
-
70
-
71
-
72
-
73
-
74
-
75
-
76
-
77
-
78
-
79
-
80
-
81
-
82
-
83
-
84
-
85
-
86
-
87
-
88
-
89
-
90
-
91
-
92
-
93
-
 94
94 -
 95
95 -
 96
96 -
 97
97 -
 98
98 -
 99
99 -
 100
100 -
 101
101 -
 102
102 -
 103
103 -
 104
104 -
 105
105 -
 106
106 -
 107
107 -
 108
108 -
 109
109 -
 110
110 -
 111
111 -
 112
112 -
 113
113 -
 114
114 -
115
-
116
-
117
-
118
-
119
-
120
-
121
-
122
-
123
-
124
-
125
-
126
-
127
-
128
-
129
-
130
-
131
 |
 |

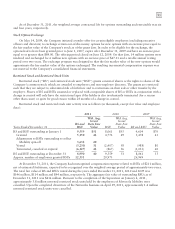
98
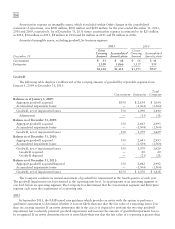
The table above includes securities on loan as part of a securities lending arrangement of $6 million of common
stock and equivalents, $6 million of U.S. government and agency obligations and $1 million of corporate bonds. All
securities on loan are fully cash collateralized.
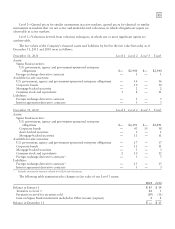
December 31, 2010 Level 1 Level 2 Level 3 Total
Common stock and equivalents $48 $ — $— $ 48
Commingled equity funds — 62 — 62
U.S. government and agency obligations — 4 — 4
Corporate bonds — 7 — 7
Mortgage-backed bonds — 8 — 8
Asset-backed bonds — 2 — 2
Commingled bond funds — 34 — 34
Commingled short-term investment funds — 4 — 4
Invested cash — 1 — 1
Fair value plan assets $48 $122 — $170
The table above includes securities on loan as part of a securities lending arrangement of $4 million of common
stock and equivalents, $2 million of U.S. government and agency obligations and $1 million of corporate bonds. All
securities on loan are fully cash collateralized.
Valuation Methodologies
Level 1—Quoted market prices in active markets are available for investments in common and preferred stock
and common stock equivalents. As such, these investments are classified within Level 1.
Level 2—The securities classified as Level 2 are comprised primarily of corporate, government, agency and
government-sponsored enterprise fixed income securities. These securities are priced using pricing services, bid/offer,
and last trade. Prices may also be obtained from brokers, counterparties, fund administrators, online securities data
services, or investment managers. Fixed income securities, including short-term instruments, may be priced using
pricing models comprised of observable inputs which include, but are not limited to, market quotations, yields,
maturities, call features, and the security’s terms and conditions.
In determining the fair value of the Company’s foreign currency derivatives, the Company uses forward
contract and option valuation models employing market observable inputs, such as spot currency rates, time value
and option volatilities. Since the Company primarily uses observable inputs in its valuation of its derivative assets
and liabilities, they are classified as Level 2 assets.
Level 3—Securities that do not have actively traded quotes as of the financial statement date. Determining the
fair value of these securities requires the use of unobservable inputs, such as indicative quotes from dealers,
extrapolated data, proprietary models and qualitative input from investment advisors. As such, these securities are
classified within Level 3.
At December 31, 2011, the Company had $437 million of investments in money market mutual funds classified
as Cash and cash equivalents in its consolidated balance sheet. The money market funds have quoted market prices
that are generally equivalent to par.
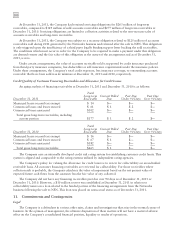
Using quoted market prices and market interest rates, the Company determined that the fair value of long-term
debt at December 31, 2011 was $1.6 billion, compared to a face value of $1.5 billion. Since considerable judgment
is required in interpreting market information, the fair value of the long-term debt is not necessarily indicative of the
amount which could be realized in a current market exchange.
All other financial instruments are carried at cost, which is not materially different than the instruments’ fair
values.