Motorola 2011 Annual Report Download - page 45
Download and view the complete annual report
Please find page 45 of the 2011 Motorola annual report below. You can navigate through the pages in the report by either clicking on the pages listed below, or by using the keyword search tool below to find specific information within the annual report.-
 1
1 -
2
-
3
-
4
-
5
-
6
-
7
-
8
-
9
-
10
-
11
-
12
-
13
-
14
-
15
-
16
-
17
-
18
-
19
-
20
-
21
-
22
-
23
-
24
-
25
-
26
-
27
-
28
-
29
-
30
-
31
-
32
-
33
-
34
-
 35
35 -
 36
36 -
 37
37 -
 38
38 -
 39
39 -
 40
40 -
 41
41 -
 42
42 -
 43
43 -
 44
44 -
 45
45 -
 46
46 -
 47
47 -
 48
48 -
 49
49 -
 50
50 -
 51
51 -
 52
52 -
 53
53 -
 54
54 -
 55
55 -
56
-
57
-
58
-
59
-
60
-
61
-
62
-
63
-
64
-
65
-
66
-
67
-
68
-
69
-
70
-
71
-
72
-
73
-
74
-
75
-
76
-
77
-
78
-
79
-
80
-
81
-
82
-
83
-
84
-
85
-
86
-
87
-
88
-
89
-
90
-
91
-
92
-
93
-
94
-
95
-
96
-
97
-
98
-
99
-
100
-
101
-
102
-
103
-
104
-
105
-
106
-
107
-
108
-
109
-
110
-
111
-
112
-
113
-
114
-
115
-
116
-
117
-
118
-
119
-
120
-
121
-
122
-
123
-
124
-
125
-
126
-
127
-
128
-
129
-
130
-
131
 |
 |

39
The increase in net sales for the segment reflects higher net sales in North America, Latin America, and Asia, while
EMEA was down slightly due to the sale of the Israel-based module business in the first quarter of 2011. Net sales
in North America continued to comprise a significant portion of the segment’s business, accounting for
approximately 63% of the segment’s net sales in both 2011 and 2010. The segment’s backlog was $2.0 billion at
both December 31, 2011 and 2010.
The segment had operating earnings of $616 million in 2011, compared to operating earnings of $534 million
in 2010. As a percentage of net sales in 2011 as compared to 2010, gross margin increased, and SG&A expenses
and R&D expenditures decreased. The increase in operating earnings was primarily due to an increase in gross
margin, driven by the 6% increase in net sales and a favorable product mix, partially offset by: (i) increased SG&A
expenses primarily due to an increase in sales incentives related to the increase in net sales and increased employee
benefit-related expenses, and (ii) an increase in Other charges primarily from net charges related to legal matters.
The decrease in R&D expenditures is primarily due to savings from cost reduction initiatives related to non-
employee related expenditures partially offset by an increase in investment in next-generation technologies and
increased employee benefit-related expenses.
Segment Results—2010 Compared to 2009
In 2010, the segment’s net sales were $5.0 billion, an increase of 5% compared to net sales of $4.8 billion in
2009. The 5% increase in net sales reflects an increase in sales of mission-critical and professional commercial radio
products and services. The segment’s net sales increased in all regions. Net sales in North America continued to
comprise a significant portion of the segment’s business, accounting for approximately 63% of the segment’s net
sales both in 2010 and 2009. The segment’s backlog was $2.0 billion at both December 31, 2010 and 2009.
The segment had operating earnings of $534 million in 2010, compared to operating earnings of $534 million
in 2009. Operating earnings were flat primarily due to an increase in gross margin, driven by the 5% increase in net
sales partially offset by, (i) an increase in SG&A expenses primarily due to an increase in sales incentives related to
the increase in net sales and increased employee benefit-related expenses, and (ii) an increase in R&D expenditures,
primarily related to an increase in employee benefit-related expenses. As a percentage of net sales in 2010 as
compared 2009, gross margin was flat, SG&A expenses increased and R&D expenditures decreased.
Enterprise Segment
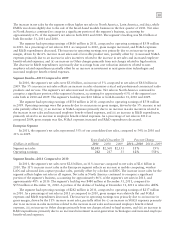
In 2011, the segment’s net sales represented 35% of our consolidated net sales, compared to 34% in 2010 and
31% in 2009.
Years Ended December 31 Percent Change
(Dollars in millions) 2011 2010 2009 2011—2010 2010—2009
Segment net sales $2,845 $2,568 $2,151 11% 19%
Operating earnings 242 217 33 12% 558%
Segment Results—2011 Compared to 2010
In 2011, the segment’s net sales were $2.8 billion, an 11% increase compared to net sales of $2.6 billion in
2010. The 11% increase in net sales in the Enterprise segment reflects an increase in mobile computing, wireless
LAN and advanced data capture product sales, partially offset by a decline in iDEN. The increase in net sales for the
segment reflects higher net sales in all regions. Net sales in North America continued to comprise a significant
portion of the segment’s business, accounting for approximately 46% of the segment’s net sales in 2011, and
approximately 48% in 2010. The segment’s backlog was $480 million at December 31, 2011, compared to
$570 million at December 31, 2010. A portion of the decline of backlog at December 31, 2011 is related to iDEN.
The segment had operating earnings of $242 million in 2011, compared to operating earnings of $217 million
in 2010. As a percentage of net sales in 2011 as compared to 2010, gross margin was relatively flat and SG&A
expenses and R&D expenditures decreased. The increase in operating earnings was primarily due to an increase in
gross margin, driven by the 11% increase in net sales, partially offset by: (i) an increase in SG&A expenses primarily
due to an increase in sales incentives related to the increase in net sales and increased employee benefit-related
expenses, (ii) an increase in Other charges primarily from net charges related to legal matters, and (iii) an increase in
R&D expenditures primarily due to an increased investment in next-generation technologies and increased employee
benefit-related expenses.