Motorola 2011 Annual Report Download - page 102
Download and view the complete annual report
Please find page 102 of the 2011 Motorola annual report below. You can navigate through the pages in the report by either clicking on the pages listed below, or by using the keyword search tool below to find specific information within the annual report.-
 1
1 -
2
-
3
-
4
-
5
-
6
-
7
-
8
-
9
-
10
-
11
-
12
-
13
-
14
-
15
-
16
-
17
-
18
-
19
-
20
-
21
-
22
-
23
-
24
-
25
-
26
-
27
-
28
-
29
-
30
-
31
-
32
-
33
-
34
-
35
-
36
-
37
-
38
-
39
-
40
-
41
-
42
-
43
-
44
-
45
-
46
-
47
-
48
-
49
-
50
-
51
-
52
-
53
-
54
-
55
-
56
-
57
-
58
-
59
-
60
-
61
-
62
-
63
-
64
-
65
-
66
-
67
-
68
-
69
-
70
-
71
-
72
-
73
-
74
-
75
-
76
-
77
-
78
-
79
-
80
-
81
-
82
-
83
-
84
-
85
-
86
-
87
-
88
-
89
-
90
-
91
-
 92
92 -
 93
93 -
 94
94 -
 95
95 -
 96
96 -
 97
97 -
 98
98 -
 99
99 -
 100
100 -
 101
101 -
 102
102 -
 103
103 -
 104
104 -
 105
105 -
 106
106 -
 107
107 -
 108
108 -
 109
109 -
 110
110 -
 111
111 -
 112
112 -
113
-
114
-
115
-
116
-
117
-
118
-
119
-
120
-
121
-
122
-
123
-
124
-
125
-
126
-
127
-
128
-
129
-
130
-
131
 |
 |

96
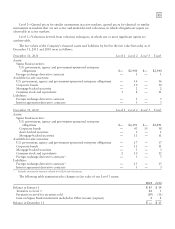
Pension and Postretirement Health Care Benefits Plan Assets
The fair value of the various pension and postretirement health care benefits plans’ assets by level in the fair
value hierarchy as of December 31, 2011 and 2010 were as follows:
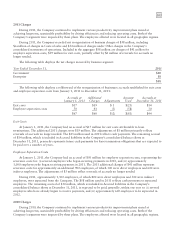
Regular Pension Plan
December 31, 2011 Level 1 Level 2 Level 3 Total
Common stock and equivalents $1,128 $ 3 — $1,131
Commingled equity funds — 1,705 — 1,705
Preferred stock 9 — — 9
U.S. government and agency obligations — 261 — 261
Other government bonds — 40 — 40
Corporate bonds — 322 — 322
Mortgage-backed bonds — 18 — 18
Commingled bond funds — 1,018 — 1,018
Commingled short-term investment funds — 215 — 215
Invested cash — 12 — 12
Total investment securities $1,137 $3,594 $— $4,731
Accrued income receivable 11
Fair value plan assets $4,742
The table above includes securities on loan as part of a securities lending arrangement of $173 million of
common stock and equivalents, $182 million of U.S. government and agency obligations and $39 million of
corporate bonds. All securities on loan are fully cash collateralized.
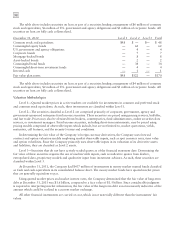
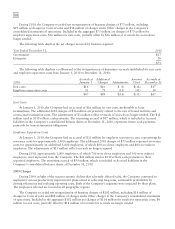
December 31, 2010 Level 1 Level 2 Level 3 Total
Common stock and equivalents $1,222 $ 3 — $1,225
Commingled equity funds — 1,597 — 1,597
Preferred stock 9 — — 9
U.S. government and agency obligations — 100 — 100
Other government bonds — 5 — 5
Corporate bonds — 185 — 185
Mortgage-backed bonds — 197 — 197
Asset-backed bonds — 40 — 40
Commingled bond funds — 850 — 850
Commingled short-term investment funds — 76 — 76
Invested cash — 16 — 16
Total investment securities $1,231 $3,069 $— $4,300
Accrued income receivable 8
Fair value plan assets $4,308
The table above includes securities on loan as part of a securities lending arrangement of $92 million of
common stock and equivalents, $41 million of U.S. government and agency obligations and $34 million of
corporate bonds. All securities on loan are fully cash collateralized.
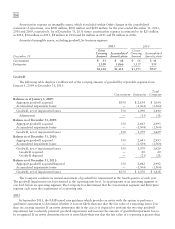
Officers’ Plan
December 31, 2011 Level 1 Level 2 Level 3 Total
Commingled short-term investment funds $— $5 $— $5
Fair value plan assets $— $5 $— $5
December 31, 2010 Level 1 Level 2 Level 3 Total
U.S. government and agency obligations $— $ 9 $— $ 9
Corporate bonds — 1 — 1
Mortgage-backed bonds — 1 — 1
Commingled short-term investment funds — 1 — 1
Fair value plan assets $— $12 $— $12