Motorola 2011 Annual Report Download - page 41
Download and view the complete annual report
Please find page 41 of the 2011 Motorola annual report below. You can navigate through the pages in the report by either clicking on the pages listed below, or by using the keyword search tool below to find specific information within the annual report.-
 1
1 -
2
-
3
-
4
-
5
-
6
-
7
-
8
-
9
-
10
-
11
-
12
-
13
-
14
-
15
-
16
-
17
-
18
-
19
-
20
-
21
-
22
-
23
-
24
-
25
-
26
-
27
-
28
-
29
-
30
-
 31
31 -
 32
32 -
 33
33 -
 34
34 -
 35
35 -
 36
36 -
 37
37 -
 38
38 -
 39
39 -
 40
40 -
 41
41 -
 42
42 -
 43
43 -
 44
44 -
 45
45 -
 46
46 -
 47
47 -
 48
48 -
 49
49 -
 50
50 -
 51
51 -
52
-
53
-
54
-
55
-
56
-
57
-
58
-
59
-
60
-
61
-
62
-
63
-
64
-
65
-
66
-
67
-
68
-
69
-
70
-
71
-
72
-
73
-
74
-
75
-
76
-
77
-
78
-
79
-
80
-
81
-
82
-
83
-
84
-
85
-
86
-
87
-
88
-
89
-
90
-
91
-
92
-
93
-
94
-
95
-
96
-
97
-
98
-
99
-
100
-
101
-
102
-
103
-
104
-
105
-
106
-
107
-
108
-
109
-
110
-
111
-
112
-
113
-
114
-
115
-
116
-
117
-
118
-
119
-
120
-
121
-
122
-
123
-
124
-
125
-
126
-
127
-
128
-
129
-
130
-
131
 |
 |

35
Geographic market sales measured by the locale of the end customer as a percent of total net sales for 2011,
2010 and 2009 are as follows:
2011 2010 2009
North America 57% 58% 59%
Latin America 9% 9% 8%
EMEA 21% 21% 21%
Asia 13% 12% 12%
100% 100% 100%
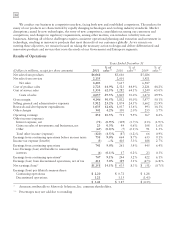
Results of Operations—2011 Compared to 2010
Net Sales
Net sales were $8.2 billion in 2011, an 8% increase compared to net sales of $7.6 billion in 2010. The increase
in net sales reflects: (i) a $309 million, or 6%, increase in net sales in the Government segment, and (ii) a $277
million, or 11%, increase in net sales in the Enterprise segment.
Gross Margin
Gross margin was $4.1 billion, or 50.5% of net sales in 2011, compared to $3.8 billion, or 50.0% of net sales,
in 2010. Gross margin dollars increased in both segments. The increase in gross margin reflects higher gross margin
in the Government segment, with margins remaining flat in the Enterprise segment. The increase in the Government
segment was primarily driven by the increase in net sales and product mix, while the Enterprise segment had margin
gains in certain product lines offset by the anticipated decline in iDEN, which has historically yielded strong
margins.
Selling, General and Administrative Expenses
Selling, general and administrative (“SG&A”) expenses increased 2% to $1.9 billion, or 23.2% of net sales, in
2011, compared to $1.9 billion, or 24.5% of net sales, in 2010. SG&A expenses as a percentage of net sales
decreased in both segments. The increase in SG&A expenses reflects higher SG&A expenses in both segments,
primarily due to (i) increased sales incentives related to the increase in net sales, and (ii) increased employee benefit-
related expenses. The increases in employee benefit-related expenses are primarily due to an increase in pension-
related expenses and the reinstatement of our 401(k) matching contributions.
Research and Development Expenditures
Research and development (“R&D”) expenditures of $1.0 billion, or 12.6% of net sales were relatively flat, in
2011, compared to $1.0 billion, or 13.6% of net sales, in 2010. R&D expenditures as a percentage of net sales
decreased in both segments. R&D expenditures were flat in 2011 compared to 2010, which reflects higher R&D
expenditures in the Enterprise segment and lower R&D expenditures in the Government segment. The slight
increase in the Enterprise segment was primarily due to investment in next-generation technologies and increased
employee benefit-related expenses. The decrease in R&D expenditures in the Government segment was primarily
due to savings from cost reduction initiatives related to non employee related expenditures, partially offset by
increased employee benefit expenses.
Other Charges
We recorded net charges of $341 million in Other charges in 2011, compared to net charges of $150 million in
2010. The charges in 2011 included: (i) $200 million of charges relating to the amortization of intangibles, (ii) $88
million of net charges relating to legal matters, (iii) $52 million of net reorganization of business charges and,
(iv) $10 million related to a long term financing receivable reserve, partially offset by $9 million of net gains from
pension plan adjustments. The charges in 2010 included: (i) $203 million of charges relating to the amortization of
intangibles, and (ii) $54 million of net reorganization of business charges, partially offset by: (i) $78 million of gains
related to intellectual property settlements and reserve adjustments, and (ii) $29 million of income related to a legal
settlement. The net reorganization of business charges are discussed in further detail in the “Reorganization of
Businesses” section.