Motorola 2011 Annual Report Download - page 40
Download and view the complete annual report
Please find page 40 of the 2011 Motorola annual report below. You can navigate through the pages in the report by either clicking on the pages listed below, or by using the keyword search tool below to find specific information within the annual report.-
 1
1 -
2
-
3
-
4
-
5
-
6
-
7
-
8
-
9
-
10
-
11
-
12
-
13
-
14
-
15
-
16
-
17
-
18
-
19
-
20
-
21
-
22
-
23
-
24
-
25
-
26
-
27
-
28
-
29
-
 30
30 -
 31
31 -
 32
32 -
 33
33 -
 34
34 -
 35
35 -
 36
36 -
 37
37 -
 38
38 -
 39
39 -
 40
40 -
 41
41 -
 42
42 -
 43
43 -
 44
44 -
 45
45 -
 46
46 -
 47
47 -
 48
48 -
 49
49 -
 50
50 -
51
-
52
-
53
-
54
-
55
-
56
-
57
-
58
-
59
-
60
-
61
-
62
-
63
-
64
-
65
-
66
-
67
-
68
-
69
-
70
-
71
-
72
-
73
-
74
-
75
-
76
-
77
-
78
-
79
-
80
-
81
-
82
-
83
-
84
-
85
-
86
-
87
-
88
-
89
-
90
-
91
-
92
-
93
-
94
-
95
-
96
-
97
-
98
-
99
-
100
-
101
-
102
-
103
-
104
-
105
-
106
-
107
-
108
-
109
-
110
-
111
-
112
-
113
-
114
-
115
-
116
-
117
-
118
-
119
-
120
-
121
-
122
-
123
-
124
-
125
-
126
-
127
-
128
-
129
-
130
-
131
 |
 |

34
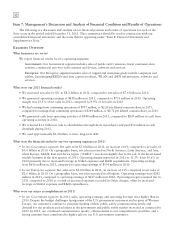
We conduct our business in competitive markets, facing both new and established competitors. The markets for
many of our products are characterized by rapidly changing technologies and evolving industry standards. Market
disruptions caused by new technologies, the entry of new competitors, consolidations among our customers and
competitors, and changes in regulatory requirements, among other matters, can introduce volatility into our
businesses. Meeting all of these challenges requires consistent operational planning and execution and investment in
technology, resulting in innovative products that meet the needs of our customers globally. As we execute on
meeting these objectives, we remain focused on taking the necessary action to design and deliver differentiated and
innovative products and services that serve the needs of our Government and Enterprise segments.
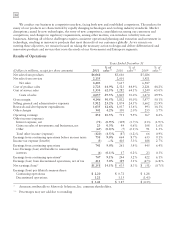
Results of Operations
Years Ended December 31
(Dollars in millions, except per share amounts) 2011 %of
sales** 2010
%of
sales** 2009
%of
sales**
Net sales from products $6,068 $5,616 $5,026
Net sales from services 2,135 2,001 1,921
Net sales 8,203 7,617 6,947
Cost of product sales 2,723 44.9% 2,523 44.9% 2,221 44.2%
Cost of service sales 1,334 62.5% 1,282 64.1% 1,249 65.0%
Costs of sales 4,057 49.5% 3,805 50.0% 3,470 49.9%
Gross margin 4,146 50.5% 3,812 50.0% 3,477 50.1%
Selling, general and administrative expenses 1,912 23.2% 1,874 24.5% 1,662 23.9%
Research and development expenditures 1,035 12.6% 1,037 13.6% 993 14.3%
Other charges 341 4.2% 150 2.0% 255 3.7%
Operating earnings 858 10.5% 751 9.9% 567 8.2%
Other income (expense):
Interest expense, net (74) (0.9)% (129) (1.7)% (133) (1.9)%
Gains on sales of investments and businesses, net 23 0.3% 49 0.6% 108 1.6%
Other (69) (0.8)% (7) (0.1)% 91 1.3%
Total other income (expense) (120) (1.5)% (87) (1.2)% 66 0.9%
Earnings from continuing operations before income taxes 738 9.0% 664 8.7% 633 9.1%
Income tax expense (benefit) (3) —% 403 5.3% 188 2.7%
Earnings from continuing operations 741 9.0% 261 3.4% 445 6.4%
Less: Earnings (loss) attributable to noncontrolling
interests (6) (0.1)% 17 0.2% 23 0.3%
Earnings from continuing operations* 747 9.1% 244 3.2% 422 6.1%
Earnings (loss) from discontinued operations, net of tax 411 5.0% 389 5.1% (473) (6.8)%
Net earnings (loss)* $1,158 14.1% $ 633 8.3% $ (51) (0.7)%
Earnings (loss) per diluted common share:
Continuing operations $ 2.20 $ 0.72 $ 1.28
Discontinued operations 1.21 1.15 (1.43)
$ 3.41 $ 1.87 $ (0.15)
* Amounts attributable to Motorola Solutions, Inc. common shareholders.
** Percentages may not add due to rounding