Motorola 2011 Annual Report Download - page 103
Download and view the complete annual report
Please find page 103 of the 2011 Motorola annual report below. You can navigate through the pages in the report by either clicking on the pages listed below, or by using the keyword search tool below to find specific information within the annual report.-
 1
1 -
2
-
3
-
4
-
5
-
6
-
7
-
8
-
9
-
10
-
11
-
12
-
13
-
14
-
15
-
16
-
17
-
18
-
19
-
20
-
21
-
22
-
23
-
24
-
25
-
26
-
27
-
28
-
29
-
30
-
31
-
32
-
33
-
34
-
35
-
36
-
37
-
38
-
39
-
40
-
41
-
42
-
43
-
44
-
45
-
46
-
47
-
48
-
49
-
50
-
51
-
52
-
53
-
54
-
55
-
56
-
57
-
58
-
59
-
60
-
61
-
62
-
63
-
64
-
65
-
66
-
67
-
68
-
69
-
70
-
71
-
72
-
73
-
74
-
75
-
76
-
77
-
78
-
79
-
80
-
81
-
82
-
83
-
84
-
85
-
86
-
87
-
88
-
89
-
90
-
91
-
92
-
 93
93 -
 94
94 -
 95
95 -
 96
96 -
 97
97 -
 98
98 -
 99
99 -
 100
100 -
 101
101 -
 102
102 -
 103
103 -
 104
104 -
 105
105 -
 106
106 -
 107
107 -
 108
108 -
 109
109 -
 110
110 -
 111
111 -
 112
112 -
 113
113 -
114
-
115
-
116
-
117
-
118
-
119
-
120
-
121
-
122
-
123
-
124
-
125
-
126
-
127
-
128
-
129
-
130
-
131
 |
 |

97
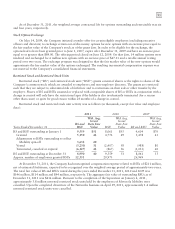
Non-U.S. Plans
December 31, 2011 Level 1 Level 2 Level 3 Total
Common stock and equivalents $312 $ — $ — $ 312
Commingled equity funds — 375 — 375
Corporate bonds — 206 — 206
Government and agency obligations — 10 — 10
Commingled bond funds — 248 — 248
Short-term investment funds — 2 — 2
Insurance contracts — — 56 56
Total investment securities $312 $841 $56 $1,209
Cash 7
Accrued income receivable 3
Fair value plan assets $1,219
December 31, 2010 Level 1 Level 2 Level 3 Total
Common stock and equivalents $339 $ — $ — $ 339
Commingled equity funds — 389 — 389
Corporate bonds — 98 — 98
Government and agency obligations — 91 — 91
Commingled bond funds — 236 — 236
Short-term investment funds — 1 — 1
Insurance contracts — — 61 61
Total investment securities $339 $815 $61 $1,215
Cash (4)
Accrued income receivable 3
Fair value plan assets $1,214
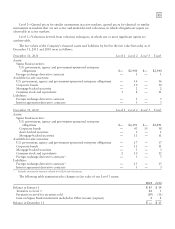
The following table summarizes the changes in fair value of the Non-U.S. pension plan assets measured using
Level 3 inputs:
2011 2010
Balance at January 1 $61 $65
Gain on assets held 21
Foreign exchange valuation adjustment (7) (5)
Balance at December 31 $56 $61
Postretirement Health Care Benefits Plan
December 31, 2011 Level 1 Level 2 Level 3 Total
Common stock and equivalents $38 $ — $— $ 38
Commingled equity funds — 54 — 54
U.S. government and agency obligations — 10 — 10
Corporate bonds — 11 — 11
Mortgage-backed bonds — 1 — 1
Commingled bond funds — 34 — 34
Commingled short-term investment funds — 7 — 7
Invested cash — — — —
Fair value plan assets $38 $117 $— $155