Motorola 2011 Annual Report Download - page 80
Download and view the complete annual report
Please find page 80 of the 2011 Motorola annual report below. You can navigate through the pages in the report by either clicking on the pages listed below, or by using the keyword search tool below to find specific information within the annual report.-
 1
1 -
2
-
3
-
4
-
5
-
6
-
7
-
8
-
9
-
10
-
11
-
12
-
13
-
14
-
15
-
16
-
17
-
18
-
19
-
20
-
21
-
22
-
23
-
24
-
25
-
26
-
27
-
28
-
29
-
30
-
31
-
32
-
33
-
34
-
35
-
36
-
37
-
38
-
39
-
40
-
41
-
42
-
43
-
44
-
45
-
46
-
47
-
48
-
49
-
50
-
51
-
52
-
53
-
54
-
55
-
56
-
57
-
58
-
59
-
60
-
61
-
62
-
63
-
64
-
65
-
66
-
67
-
68
-
69
-
 70
70 -
 71
71 -
 72
72 -
 73
73 -
 74
74 -
 75
75 -
 76
76 -
 77
77 -
 78
78 -
 79
79 -
 80
80 -
 81
81 -
 82
82 -
 83
83 -
 84
84 -
 85
85 -
 86
86 -
 87
87 -
 88
88 -
 89
89 -
 90
90 -
91
-
92
-
93
-
94
-
95
-
96
-
97
-
98
-
99
-
100
-
101
-
102
-
103
-
104
-
105
-
106
-
107
-
108
-
109
-
110
-
111
-
112
-
113
-
114
-
115
-
116
-
117
-
118
-
119
-
120
-
121
-
122
-
123
-
124
-
125
-
126
-
127
-
128
-
129
-
130
-
131
 |
 |

74
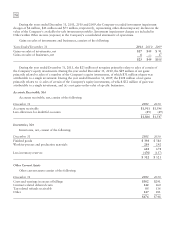
During the years ended December 31, 2011, 2010 and 2009, the Company recorded investment impairment
charges of $4 million, $21 million and $75 million, respectively, representing other-than-temporary declines in the
value of the Company’s available-for-sale investment portfolio. Investment impairment charges are included in
Other within Other income (expense) in the Company’s consolidated statements of operations.
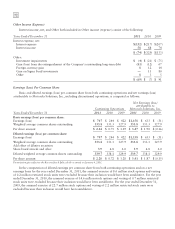
Gains on sales of investments and businesses, consists of the following:
Years Ended December 31 2011 2010 2009
Gains on sales of investments, net $17 $49 $ 91
Gains on sales of businesses, net 6—17
$23 $49 $108
During the year ended December 31, 2011, the $23 million of net gains primarily relate to sales of certain of
the Company’s equity investments. During the year ended December 31, 2010, the $49 million of net gains
primarily related to sales of a number of the Company’s equity investments, of which $31 million of gain was
attributable to a single investment. During the year ended December 31, 2009, the $108 million of net gains
primarily relates to: (i) sales of certain of the Company’s equity investments, of which $32 million of gain was
attributable to a single investment, and (ii) a net gain on the sales of specific businesses.
Accounts Receivable, Net
Accounts receivable, net, consist of the following:
December 31 2011 2010
Accounts receivable $1,911 $1,596
Less allowance for doubtful accounts (45) (49)
$1,866 $1,547
Inventories, Net
Inventories, net, consist of the following:
December 31 2011 2010
Finished goods $ 398 $ 386
Work-in-process and production materials 284 292
682 678
Less inventory reserves (170) (157)
$ 512 $ 521
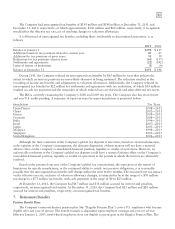
Other Current Assets
Other current assets consist of the following:
December 31 2011 2010
Costs and earnings in excess of billings $302 $291
Contract-related deferred costs 142 160
Tax-related refunds receivable 85 116
Other 147 181
$676 $748