Motorola 2011 Annual Report Download - page 44
Download and view the complete annual report
Please find page 44 of the 2011 Motorola annual report below. You can navigate through the pages in the report by either clicking on the pages listed below, or by using the keyword search tool below to find specific information within the annual report.-
 1
1 -
2
-
3
-
4
-
5
-
6
-
7
-
8
-
9
-
10
-
11
-
12
-
13
-
14
-
15
-
16
-
17
-
18
-
19
-
20
-
21
-
22
-
23
-
24
-
25
-
26
-
27
-
28
-
29
-
30
-
31
-
32
-
33
-
 34
34 -
 35
35 -
 36
36 -
 37
37 -
 38
38 -
 39
39 -
 40
40 -
 41
41 -
 42
42 -
 43
43 -
 44
44 -
 45
45 -
 46
46 -
 47
47 -
 48
48 -
 49
49 -
 50
50 -
 51
51 -
 52
52 -
 53
53 -
 54
54 -
55
-
56
-
57
-
58
-
59
-
60
-
61
-
62
-
63
-
64
-
65
-
66
-
67
-
68
-
69
-
70
-
71
-
72
-
73
-
74
-
75
-
76
-
77
-
78
-
79
-
80
-
81
-
82
-
83
-
84
-
85
-
86
-
87
-
88
-
89
-
90
-
91
-
92
-
93
-
94
-
95
-
96
-
97
-
98
-
99
-
100
-
101
-
102
-
103
-
104
-
105
-
106
-
107
-
108
-
109
-
110
-
111
-
112
-
113
-
114
-
115
-
116
-
117
-
118
-
119
-
120
-
121
-
122
-
123
-
124
-
125
-
126
-
127
-
128
-
129
-
130
-
131
 |
 |

38
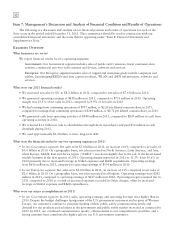
from the extinguishment of a portion of our outstanding long-term debt, partially offset by: (i) a $12 million foreign
currency gain, and (ii) an $11 million gain from Sigma Fund investments. The net income in 2009 was primarily
comprised of: (i) $80 million of gains from Sigma Fund investments, (ii) $67 million gain related to the
extinguishment of our outstanding long-term debt, and (iii) $14 million foreign currency gain, partially offset by
$75 million other-than-temporary investment impairment charges.
Effective Tax Rate
We recorded $403 million of net tax expense in 2010, resulting in an effective tax rate of 61%, compared to
$188 million of net tax expense, resulting in an effective tax rate of 30% in 2009. Our effective tax rate in 2010
was higher than the U.S. statutory rate of 35% primarily due to an increase in the U.S. federal income tax accrual
for repatriation of undistributed foreign earnings and a non-cash tax charge related to the Medicare Part D subsidy
tax law change, partially offset by reductions in unrecognized tax benefits for facts that now indicate the extent to
which certain tax positions are more-likely-than-not of being sustained.
Our effective tax rate will change from period to period based on non-recurring events, such as the settlement
of income tax audits, changes in valuation allowances and the tax impact of significant unusual or extraordinary
items, as well as recurring factors including changes in the geographic mix of income before taxes and effects of
various global income tax strategies.
Earnings from Continuing Operations
After taxes, and excluding Earnings attributable to noncontrolling interests, we had earnings from continuing
operations of $244 million, or $0.72 per diluted share, in 2010, compared to net earnings from continuing
operations of $422 million, or $1.28 per diluted share, in 2009.
The decrease in the earnings from continuing operations after income taxes in 2010 compared to 2009 was
primarily attributed to: (i) $215 million increase in tax expense, (ii) $212 million increase in SG&A expenses, and
(iii) $153 million increase in Total other income (expense), partially offset by (i) $335 million increase in gross
margin, and (ii) $105 million decrease in Other charges.
Earnings (loss) from Discontinued Operations
After taxes, we had earnings from discontinued operations of $389 million, or $1.15 per diluted share, in 2010,
compared to a loss from discontinued operations of $473 million, or $1.43 per diluted share, in 2009. The
improvement in earnings from discontinued operations in 2010 compared to 2009 was primarily attributable to a
significant decrease in the loss from the operations of Motorola Mobility, and an increase in earnings from the
Networks business.
Segment Information
The following commentary should be read in conjunction with the financial results of each operating business
segment as detailed in Note 12, “Information by Segment and Geographic Region,” to our consolidated financial
statements. Net sales and operating results for our two operating business segments for 2011, 2010, and 2009 are
presented below.
Government Segment
In 2011, the segment’s net sales represented 65% of our consolidated net sales, compared to 66% in 2010 and
69% in 2009.
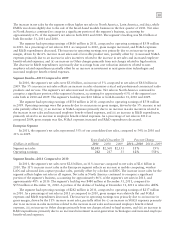
Years Ended December 31 Percent Change
(Dollars in millions) 2011 2010 2009 2011—2010 2010—2009
Segment net sales $5,358 $5,049 $4,796 6% 5%
Operating earnings 616 534 534 15% —
Segment Results—2011 Compared to 2010
In 2011, the segment’s net sales were $5.4 billion, a 6% increase compared to net sales of $5.0 billion in 2010.
The 6% increase in net sales in the Government segment reflects an increase in sales of mission-critical and
professional commercial radio products and services.