Motorola 2011 Annual Report Download - page 92
Download and view the complete annual report
Please find page 92 of the 2011 Motorola annual report below. You can navigate through the pages in the report by either clicking on the pages listed below, or by using the keyword search tool below to find specific information within the annual report.-
 1
1 -
2
-
3
-
4
-
5
-
6
-
7
-
8
-
9
-
10
-
11
-
12
-
13
-
14
-
15
-
16
-
17
-
18
-
19
-
20
-
21
-
22
-
23
-
24
-
25
-
26
-
27
-
28
-
29
-
30
-
31
-
32
-
33
-
34
-
35
-
36
-
37
-
38
-
39
-
40
-
41
-
42
-
43
-
44
-
45
-
46
-
47
-
48
-
49
-
50
-
51
-
52
-
53
-
54
-
55
-
56
-
57
-
58
-
59
-
60
-
61
-
62
-
63
-
64
-
65
-
66
-
67
-
68
-
69
-
70
-
71
-
72
-
73
-
74
-
75
-
76
-
77
-
78
-
79
-
80
-
81
-
 82
82 -
 83
83 -
 84
84 -
 85
85 -
 86
86 -
 87
87 -
 88
88 -
 89
89 -
 90
90 -
 91
91 -
 92
92 -
 93
93 -
 94
94 -
 95
95 -
 96
96 -
 97
97 -
 98
98 -
 99
99 -
 100
100 -
 101
101 -
 102
102 -
103
-
104
-
105
-
106
-
107
-
108
-
109
-
110
-
111
-
112
-
113
-
114
-
115
-
116
-
117
-
118
-
119
-
120
-
121
-
122
-
123
-
124
-
125
-
126
-
127
-
128
-
129
-
130
-
131
 |
 |

86
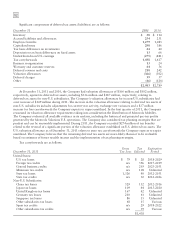
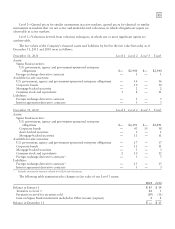
The status of the Company’s plans is as follows:
2011 2010
Regular
Officers’
and
MSPP Non
U.S. Regular
Officers’
and
MSPP
Non
U.S.
Change in benefit obligation:
Benefit obligation at January 1 $ 6,129 $ 44 $1,423 $ 5,821 $ 52 $1,438
Service cost —— 17 —— 24
Interest cost 341 3 72 341 3 84
Plan amendments —— 20 — — (115)
Settlement/curtailment — — (19) —— 2
Actuarial (gain) loss 702 12 123 173 4 54
Foreign exchange valuation adjustment —— (10) —— (19)
Employee contributions —— — —— 5
Tax payments — (5) — — (3) —
Benefit payments (224) (16) (38) (206) (12) (50)
Benefit obligation at December 31 6,948 38 1,588 6,129 44 1,423
Change in plan assets:
Fair value at January 1 4,308 12 1,214 3,898 17 1,102
Return on plan assets 178 — 23 466 1 125
Company contributions 480 9 38 150 7 41
Settlements/curtailments — — (19) —— —
Employee contributions —— — —— 5
Foreign exchange valuation adjustment —— 1 —— (9)
Tax payments from plan assets —— — — (1) —
Benefit payments from plan assets (224) (16) (38) (206) (12) (50)
Fair value at December 31 4,742 5 1,219 4,308 12 1,214
Funded status of the plan (2,206) (32) (369) (1,821) (32) (209)
Unrecognized net loss 3,527 9 462 2,799 11 311
Unrecognized prior service cost — — (55) — — (99)
Prepaid (accrued) pension cost $ 1,321 $(23) $ 38 $ 978 $(21) $ 3
Components of prepaid (accrued) pension cost:
Non-current benefit liability $(2,206) $(32) $ (369) $(1,821) $(32) $ (209)
Deferred income taxes 1,292 3 26 1,033 4 14
Accumulated other comprehensive loss 2,235 6 381 1,766 7 198
Prepaid (accrued) pension cost $ 1,321 $(23) $ 38 $ 978 $(21) $ 3
It is estimated that the net periodic cost for 2012 will include amortization of the unrecognized net loss and
prior service costs for the Regular Plan, Officers’ and MSPP Plans, and Non-U.S. Plans, currently included in
Accumulated other comprehensive loss, of $271 million, $2 million, and $19 million, respectively.
The Company uses a five-year, market-related asset value method of recognizing asset-related gains and losses.
Unrecognized gains and losses are being amortized over periods ranging from 5 to 9 years. Prior service costs are
being amortized over periods ranging from 10 to 12 years. Benefits under all pension plans are valued based upon
the projected unit credit cost method.
In April 2011, the Company recognized a curtailment gain in its United Kingdom defined benefit plan, and a
settlement loss in its Japanese defined benefit plan, due to the sale of the Networks business. As a result, the
Company recorded a net gain to its statement of operations of $9 million.
Certain actuarial assumptions such as the discount rate and the long-term rate of return on plan assets have a
significant effect on the amounts reported for net periodic cost and benefit obligation. The assumed discount rates
reflect the prevailing market rates of a universe of high-quality, non-callable, corporate bonds currently available
that, if the obligation were settled at the measurement date, would provide the necessary future cash flows to pay