Motorola 2011 Annual Report Download - page 36
Download and view the complete annual report
Please find page 36 of the 2011 Motorola annual report below. You can navigate through the pages in the report by either clicking on the pages listed below, or by using the keyword search tool below to find specific information within the annual report.-
 1
1 -
 2
2 -
 3
3 -
 4
4 -
 5
5 -
 6
6 -
 7
7 -
 8
8 -
 9
9 -
 10
10 -
 11
11 -
 12
12 -
 13
13 -
 14
14 -
 15
15 -
 16
16 -
 17
17 -
 18
18 -
 19
19 -
 20
20 -
 21
21 -
 22
22 -
 23
23 -
 24
24 -
 25
25 -
 26
26 -
 27
27 -
 28
28 -
 29
29 -
 30
30 -
 31
31 -
 32
32 -
 33
33 -
 34
34 -
 35
35 -
 36
36 -
 37
37 -
 38
38 -
 39
39 -
 40
40 -
 41
41 -
 42
42 -
 43
43 -
 44
44 -
 45
45 -
 46
46 -
 47
47 -
 48
48 -
 49
49 -
 50
50 -
 51
51 -
 52
52 -
 53
53 -
 54
54 -
 55
55 -
 56
56 -
 57
57 -
 58
58 -
 59
59 -
 60
60 -
 61
61 -
 62
62 -
 63
63 -
 64
64 -
 65
65 -
 66
66 -
 67
67 -
 68
68 -
 69
69 -
 70
70 -
 71
71 -
 72
72 -
 73
73 -
 74
74 -
 75
75 -
 76
76 -
 77
77 -
 78
78 -
 79
79 -
 80
80 -
 81
81 -
 82
82 -
 83
83 -
 84
84 -
 85
85 -
 86
86 -
 87
87 -
 88
88 -
 89
89 -
 90
90 -
 91
91 -
 92
92 -
 93
93 -
 94
94 -
 95
95 -
 96
96 -
 97
97 -
 98
98 -
 99
99 -
 100
100 -
 101
101 -
 102
102 -
 103
103 -
 104
104 -
 105
105 -
 106
106 -
 107
107 -
 108
108 -
 109
109 -
 110
110 -
 111
111 -
 112
112 -
 113
113 -
 114
114 -
 115
115 -
 116
116 -
 117
117 -
 118
118 -
 119
119 -
 120
120 -
 121
121 -
 122
122 -
 123
123 -
 124
124 -
 125
125 -
 126
126 -
 127
127 -
 128
128 -
 129
129 -
 130
130 -
 131
131
 |
 |

30
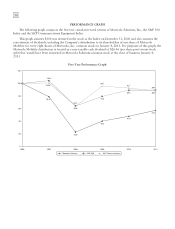
PERFORMANCE GRAPH
The following graph compares the five-year cumulative total returns of Motorola Solutions, Inc., the S&P 500
Index and the S&P Communications Equipment Index.
This graph assumes $100 was invested in the stock or the Index on December 31, 2006 and also assumes the
reinvestment of dividends, including the Company’s distribution to its shareholders of one share of Motorola
Mobility for every eight shares of Motorola, Inc. common stock on January 4, 2011. For purposes of this graph, the
Motorola Mobility distribution is treated as a non-taxable cash dividend of $26.46 (per share post reverse stock
split) that would have been reinvested in Motorola Solutions common stock at the close of business January 4,
2011.
57.2
79.0
47.9
40.2
63.8
89.4
100.8
89.4
79.3
22.8
88.2
104.4
64.2
95.7 92.7
Five-Year Performance Graph
0
20
40
60
80
100
120
2007 2008 2009 2010 20112006
Motorola Solutions S&P 500 S&P Communications
