Motorola 2011 Annual Report Download - page 69
Download and view the complete annual report
Please find page 69 of the 2011 Motorola annual report below. You can navigate through the pages in the report by either clicking on the pages listed below, or by using the keyword search tool below to find specific information within the annual report.-
 1
1 -
2
-
3
-
4
-
5
-
6
-
7
-
8
-
9
-
10
-
11
-
12
-
13
-
14
-
15
-
16
-
17
-
18
-
19
-
20
-
21
-
22
-
23
-
24
-
25
-
26
-
27
-
28
-
29
-
30
-
31
-
32
-
33
-
34
-
35
-
36
-
37
-
38
-
39
-
40
-
41
-
42
-
43
-
44
-
45
-
46
-
47
-
48
-
49
-
50
-
51
-
52
-
53
-
54
-
55
-
56
-
57
-
58
-
 59
59 -
 60
60 -
 61
61 -
 62
62 -
 63
63 -
 64
64 -
 65
65 -
 66
66 -
 67
67 -
 68
68 -
 69
69 -
 70
70 -
 71
71 -
 72
72 -
 73
73 -
 74
74 -
 75
75 -
 76
76 -
 77
77 -
 78
78 -
 79
79 -
80
-
81
-
82
-
83
-
84
-
85
-
86
-
87
-
88
-
89
-
90
-
91
-
92
-
93
-
94
-
95
-
96
-
97
-
98
-
99
-
100
-
101
-
102
-
103
-
104
-
105
-
106
-
107
-
108
-
109
-
110
-
111
-
112
-
113
-
114
-
115
-
116
-
117
-
118
-
119
-
120
-
121
-
122
-
123
-
124
-
125
-
126
-
127
-
128
-
129
-
130
-
131
 |
 |

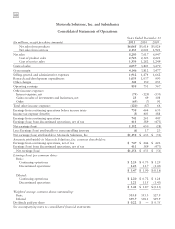
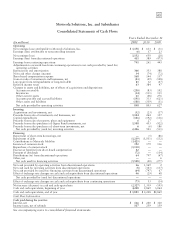
63
Motorola Solutions, Inc. and Subsidiaries
Consolidated Statements of Cash Flows
Years Ended December 31
(In millions) 2011 2010 2009
Operating
Net earnings (loss) attributable to Motorola Solutions, Inc. $ 1,158 $ 633 $ (51)
Earnings (loss) attributable to noncontrolling interests (6) 17 23
Net earnings (loss) 1,152 650 (28)
Earnings (loss) from discontinued operations 411 389 (473)
Earnings from continuing operations 741 261 445
Adjustments to reconcile loss from continuing operations to net cash provided by (used for)
operating activities:
Depreciation and amortization 366 353 388
Non-cash other charges (income) 34 (74) (72)
Share-based compensation expense 168 144 137
Gain on sales of investments and businesses, net (23) (49) (108)
Loss (gain) from extinguishment of long-term debt 81 12 (67)
Deferred income taxes 63 384 47
Changes in assets and liabilities, net of effects of acquisitions and dispositions:
Accounts receivable (250) (83) 102
Inventories (14) (111) 111
Other current assets 61 (48) 276
Accounts payable and accrued liabilities (191) 333 (621)
Other assets and liabilities (188) (319) (11)
Net cash provided by operating activities 848 803 627
Investing
Acquisitions and investments, net (32) (23) (17)
Proceeds from sales of investments and businesses, net 1,124 264 357
Capital expenditures (186) (192) (136)
Proceeds from sales of property, plant and equipment 627 1
Proceeds from sales (purchases of) Sigma Fund investments, net 1,508 453 (922)
Proceeds from sales (purchases of) short-term investments, net 6(6) 186
Net cash provided by (used for) investing activities 2,426 523 (531)
Financing
Repayment of short-term borrowings, net —(5) (86)
Repayment of debt (1,219) (1,011) (132)
Contributions to Motorola Mobility (3,425) ——
Issuance of common stock 192 179 116
Repurchase of common stock (1,110) ——
Excess tax benefits from share-based compensation 42 ——
Payment of dividends (72) — (114)
Distributions (to) from discontinued operations 64 797 (67)
Other, net ——6
Net cash used for financing activities (5,528) (40) (277)
Net cash provided by operating activities from discontinued operations 26 1,169 2
Net cash used for investing activities from discontinued operations (8) (343) (137)
Net cash provided by (used for) financing activities from discontinued operations (64) (797) 67
Effect of exchange rate changes on cash and cash equivalents from discontinued operations 46 (29) 68
Net cash provided by (used for) discontinued operations ———
Effect of exchange rate changes on cash and cash equivalents from continuing operations (73) 53 (14)
Net increase (decrease) in cash and cash equivalents (2,327) 1,339 (195)
Cash and cash equivalents, beginning of year 4,208 2,869 3,064
Cash and cash equivalents, end of year $ 1,881 $ 4,208 $2,869
Cash Flow Information
Cash paid during the year for:
Interest, net $ 166 $ 240 $ 320
Income taxes, net of refunds 107 259 159
See accompanying notes to consolidated financial statements.