Motorola 2011 Annual Report Download - page 46
Download and view the complete annual report
Please find page 46 of the 2011 Motorola annual report below. You can navigate through the pages in the report by either clicking on the pages listed below, or by using the keyword search tool below to find specific information within the annual report.-
 1
1 -
2
-
3
-
4
-
5
-
6
-
7
-
8
-
9
-
10
-
11
-
12
-
13
-
14
-
15
-
16
-
17
-
18
-
19
-
20
-
21
-
22
-
23
-
24
-
25
-
26
-
27
-
28
-
29
-
30
-
31
-
32
-
33
-
34
-
35
-
 36
36 -
 37
37 -
 38
38 -
 39
39 -
 40
40 -
 41
41 -
 42
42 -
 43
43 -
 44
44 -
 45
45 -
 46
46 -
 47
47 -
 48
48 -
 49
49 -
 50
50 -
 51
51 -
 52
52 -
 53
53 -
 54
54 -
 55
55 -
 56
56 -
57
-
58
-
59
-
60
-
61
-
62
-
63
-
64
-
65
-
66
-
67
-
68
-
69
-
70
-
71
-
72
-
73
-
74
-
75
-
76
-
77
-
78
-
79
-
80
-
81
-
82
-
83
-
84
-
85
-
86
-
87
-
88
-
89
-
90
-
91
-
92
-
93
-
94
-
95
-
96
-
97
-
98
-
99
-
100
-
101
-
102
-
103
-
104
-
105
-
106
-
107
-
108
-
109
-
110
-
111
-
112
-
113
-
114
-
115
-
116
-
117
-
118
-
119
-
120
-
121
-
122
-
123
-
124
-
125
-
126
-
127
-
128
-
129
-
130
-
131
 |
 |

40
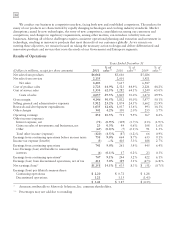
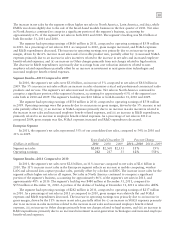
Segment Results—2010 Compared to 2009
In 2010, the segment’s net sales were $2.6 billion, an increase of 19% compared to net sales of $2.2 billion in
2009. The 19% increase in net sales primarily reflects an increase in mobile computing, wireless LAN, advanced
data capture, RFID, and iDEN. The increase in net sales for the segment reflects higher net sales in all regions. Net
sales in North America comprised a significant portion of the segment’s business, accounting for approximately
48% of the segment’s net sales in 2010, and approximately 51% in 2009. The segment’s backlog was $570 million
at December 31, 2010, compared to $575 million at December 31, 2009.
The segment had operating earnings of $217 million in 2010, compared to operating earnings of $33 million in
2009. The increase in the operating earnings was primarily due to: (i) an increase in gross margin, driven by the
19% increase in net sales, and (ii) a decrease in Other charges, primarily relating to a gain recorded for an
intellectual property settlement and a legal settlement, partially offset by: (i) an increase in SG&A expenses
primarily due to an increase in sales incentives related to the increase in net sales and increased employee benefit-
related expenses, and (ii) an increase in R&D expenditures, primarily related to an increase employee benefit-related
expenses. As a percentage of net sales in 2010 as compared 2009, gross margin, SG&A expenses and R&D
expenditures all decreased.
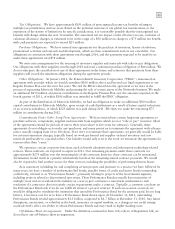
Reorganization of Businesses
During 2011, we implemented various productivity improvement plans aimed at achieving long term,
sustainable profitability by driving efficiencies and reducing operating costs. In 2011, we recorded net
reorganization of business charges of $58 million, relating to the separation of 900 employees, of which 300 were
direct employees and 600 were indirect employees. These charges included $6 million of Costs of sales and $52
million of charges under Other charges in our consolidated statements of operations. Included in the aggregate $58
million are charges of: (i) $41 million for employee separation costs, and (ii) $19 million for exit costs, partially
offset by $2 million of reversals for accruals no longer needed.
We realized cost-saving benefits of approximately $18 million in 2011 from the plans that were initiated during
2011, primarily in SG&A expenses. Beyond 2011, we expect the reorganization plans initiated during 2011 to
provide annualized cost savings of approximately $60 million.
During 2010, we recorded net reorganization of business charges of $73 million, including $73 million for
employee separation costs, $16 million for exit costs, partially offset by $16 million for reversals of accruals no
longer needed. During 2009, we recorded net reorganization of business charges of $102 million, including $114
million for employee separation costs, $6 million for exit costs, partially offset by $18 million of reversals of
accruals no longer needed.
The following table displays the net charges incurred by business segment:
Year Ended December 31, 2011 2010 2009
Government $40 $57 $ 67
Enterprise 18 16 35
58 73 102
Cash payments for exit costs and employee separations in connection with these reorganization plans were $81
million in 2011, as compared to $53 million in 2010. The $44 million reorganization of businesses accrual at
December 31, 2011, includes: (i) $30 million relating to employee separation costs that are expected to be paid in
2012, and (ii) $14 million relating to lease termination obligations that are expected to be paid over a number of
years.
Liquidity and Capital Resources
We returned $1.1 billion in cash to shareholders through share repurchases and paid $72 million in cash
dividends during 2011 and decreased the aggregate of our: (i) current portion of long-term debt, and (ii) long-term
debt, by approximately $1.2 billion from $2.7 billion as of December 31, 2010 to $1.5 billion as of December 31,
2011.
As highlighted in the consolidated statements of cash flows, our liquidity and available capital resources are
impacted by four key components: (i) cash and cash equivalents, (ii) operating activities, (iii) investing activities, and
(iv) financing activities.