Motorola 2011 Annual Report Download - page 42
Download and view the complete annual report
Please find page 42 of the 2011 Motorola annual report below. You can navigate through the pages in the report by either clicking on the pages listed below, or by using the keyword search tool below to find specific information within the annual report.-
 1
1 -
2
-
3
-
4
-
5
-
6
-
7
-
8
-
9
-
10
-
11
-
12
-
13
-
14
-
15
-
16
-
17
-
18
-
19
-
20
-
21
-
22
-
23
-
24
-
25
-
26
-
27
-
28
-
29
-
30
-
31
-
 32
32 -
 33
33 -
 34
34 -
 35
35 -
 36
36 -
 37
37 -
 38
38 -
 39
39 -
 40
40 -
 41
41 -
 42
42 -
 43
43 -
 44
44 -
 45
45 -
 46
46 -
 47
47 -
 48
48 -
 49
49 -
 50
50 -
 51
51 -
 52
52 -
53
-
54
-
55
-
56
-
57
-
58
-
59
-
60
-
61
-
62
-
63
-
64
-
65
-
66
-
67
-
68
-
69
-
70
-
71
-
72
-
73
-
74
-
75
-
76
-
77
-
78
-
79
-
80
-
81
-
82
-
83
-
84
-
85
-
86
-
87
-
88
-
89
-
90
-
91
-
92
-
93
-
94
-
95
-
96
-
97
-
98
-
99
-
100
-
101
-
102
-
103
-
104
-
105
-
106
-
107
-
108
-
109
-
110
-
111
-
112
-
113
-
114
-
115
-
116
-
117
-
118
-
119
-
120
-
121
-
122
-
123
-
124
-
125
-
126
-
127
-
128
-
129
-
130
-
131
 |
 |

36
Net Interest Expense
Net interest expense was $74 million in 2011, compared to net interest expense of $129 million in 2010. Net
interest expense in 2011 included interest expense of $132 million, partially offset by interest income of $58 million.
Net interest expense in 2010 includes interest expense of $217 million, partially offset by interest income of $88
million. The decrease in net interest expense is primarily attributable to lower interest expense driven by lower
average debt outstanding partially offset by lower interest income driven by lower average cash and cash equivalents
and lower yields during 2011 compared to 2010.
Gains on Sales of Investments and Businesses
Gains on sales of investments and businesses were $23 million in 2011, compared to a gain of $49 million in
2010. In 2011, the net gain was primarily comprised of gains related to sales of certain of our equity investments. In
2010, the net gain was primarily comprised of a gain on the sale of a single investment.
Other
Net Other expense was $69 million in 2011, compared to net Other expense of $7 million in 2010. The net
Other expense in 2011 was primarily comprised of an $81 million loss from the extinguishment of a portion of our
outstanding long-term debt, partially offset by an $8 million foreign currency gain. The net expense in 2010 was
primarily comprised of: (i) $21 million of investment impairments, and (ii) a $12 million loss from the
extinguishment of a portion of our outstanding long-term debt, partially offset by: (i) a $12 million foreign currency
gain, and (ii) an $11 million gain from Sigma Fund investments.
Effective Tax Rate
We recorded $3 million of net tax benefit in 2011, resulting in a negative effective tax rate on continuing
operations compared to $403 million of net tax expense in 2010, resulting in an effective tax rate of 61%. Our
negative effective tax rate in 2011 was primarily due to: (i) a $274 million tax benefit related to the reversal of a
significant portion of the valuation allowance established on the U.S. deferred tax assets, and (ii) reductions in
unrecognized tax benefits for facts that now indicate the extent to which certain tax positions are more-likely-
than-not of being sustained, partially offset by an increase in the U.S. federal income tax accrual for repatriation of
undistributed foreign earnings.
The valuation allowances on our deferred tax assets are discussed further in Note 6, “Income Taxes,” of our
consolidated financial statements. Our effective tax rate will change from period to period based on non-recurring
events, such as the settlement of income tax audits, changes in valuation allowances and the tax impact of
significant unusual or extraordinary items, as well as recurring factors including changes in the geographic mix of
income and effects of various global income tax strategies.
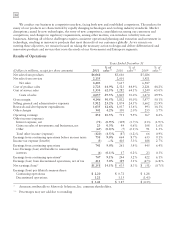
Earnings from Continuing Operations
After taxes, and excluding earnings attributable to noncontrolling interests, we had net earnings from
continuing operations of $747 million, or $2.20 per diluted share, in 2011, compared to $244 million, or $0.72 per
diluted share, in 2010. The improvement in the earnings from continuing operations in 2011 compared to 2010 was
primarily attributable to a $334 million increase in gross margin and a $406 million decrease in tax expense. These
improvements were partially offset by a $191 million increase in other charges, and a $38 million increase in SG&A
expenses.
Earnings (loss) from Discontinued Operations
After taxes, we had earnings from discontinued operations of $411 million, or $1.21 per diluted share, in 2011,
compared to earnings from discontinued operations of $389 million, or $1.15 per diluted share, in 2010. The
earnings from discontinued operations in 2011 was primarily from the operations and gain from the sale of the
Networks business. The earnings from discontinued operations in 2010 were primarily from the Networks business,
partially offset by losses from Motorola Mobility.