Motorola 2011 Annual Report Download - page 112
Download and view the complete annual report
Please find page 112 of the 2011 Motorola annual report below. You can navigate through the pages in the report by either clicking on the pages listed below, or by using the keyword search tool below to find specific information within the annual report.-
 1
1 -
2
-
3
-
4
-
5
-
6
-
7
-
8
-
9
-
10
-
11
-
12
-
13
-
14
-
15
-
16
-
17
-
18
-
19
-
20
-
21
-
22
-
23
-
24
-
25
-
26
-
27
-
28
-
29
-
30
-
31
-
32
-
33
-
34
-
35
-
36
-
37
-
38
-
39
-
40
-
41
-
42
-
43
-
44
-
45
-
46
-
47
-
48
-
49
-
50
-
51
-
52
-
53
-
54
-
55
-
56
-
57
-
58
-
59
-
60
-
61
-
62
-
63
-
64
-
65
-
66
-
67
-
68
-
69
-
70
-
71
-
72
-
73
-
74
-
75
-
76
-
77
-
78
-
79
-
80
-
81
-
82
-
83
-
84
-
85
-
86
-
87
-
88
-
89
-
90
-
91
-
92
-
93
-
94
-
95
-
96
-
97
-
98
-
99
-
100
-
101
-
 102
102 -
 103
103 -
 104
104 -
 105
105 -
 106
106 -
 107
107 -
 108
108 -
 109
109 -
 110
110 -
 111
111 -
 112
112 -
 113
113 -
 114
114 -
 115
115 -
 116
116 -
 117
117 -
 118
118 -
 119
119 -
 120
120 -
 121
121 -
 122
122 -
123
-
124
-
125
-
126
-
127
-
128
-
129
-
130
-
131
 |
 |

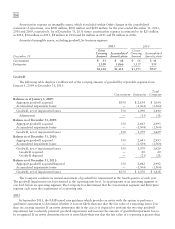
106
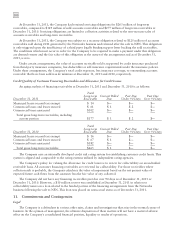
Amortization expense on intangible assets, which is included within Other charges in the consolidated
statement of operations, was $200 million, $203 million and $218 million for the years ended December 31, 2011,
2010 and 2009, respectively. As of December 31, 2011 future amortization expense is estimated to be $25 million
in 2012, $10 million in 2013, $8 million in 2014 and $3 million in 2015 and $2 million in 2016.
Amortized intangible assets, excluding goodwill, by business segment:
2011 2010
December 31
Gross
Carrying
Amount Accumulated
Amortization
Gross
Carrying
Amount
Accumulated
Amortization
Government $53 $48 $56 $48
Enterprise 1,109 1,066 1,137 899
$1,162 $1,114 $1,193 $947
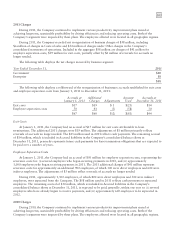
Goodwill
The following table displays a rollforward of the carrying amount of goodwill by reportable segment from
January 1, 2009 to December 31, 2011:
Government Enterprise
Total
Company
Balances as of January 1, 2009:
Aggregate goodwill acquired $350 $ 2,654 $ 3,004
Accumulated impairment losses — (1,564) (1,564)
Goodwill, net of impairment losses 350 1,090 1,440
Adjustments — (11) (11)
Balance as of December 31, 2009:
Aggregate goodwill acquired 350 2,643 2,993
Accumulated impairment losses — (1,564) (1,564)
Goodwill, net of impairment losses 350 1,079 1,429
Balance as of December 31, 2010:
Aggregate goodwill acquired 350 2,643 2,993
Accumulated impairment losses — (1,564) (1,564)
Goodwill, net of impairment losses 350 1,079 1,429
Goodwill acquired — 20 20
Goodwill disposed — (21) (21)
Balance as of December 31, 2011:
Aggregate goodwill acquired/disposed 350 2,642 2,992
Accumulated impairment losses — (1,564) (1,564)
Goodwill, net of impairment losses $350 $ 1,078 $ 1,428
The Company conducts its annual assessment of goodwill for impairment in the fourth quarter of each year.
The goodwill impairment test is performed at the reporting unit level. A reporting unit is an operating segment or
one level below an operating segment. The Company has determined that the Government segment and Enterprise
segment each meet the requirement of a reporting unit.
2011
In September 2011, the FASB issued new guidance which provides an entity with the option to perform a
qualitative assessment to determine whether it is more-likely-than-not that the fair value of a reporting unit is less
than its carrying amount. If an entity determines this is the case, it is required to perform the two-step goodwill
impairment test to identify potential goodwill impairment and measure the amount of goodwill impairment loss to
be recognized. If an entity determines that it is more-likely-than-not that the fair value of a reporting is greater than