Motorola 2011 Annual Report Download - page 43
Download and view the complete annual report
Please find page 43 of the 2011 Motorola annual report below. You can navigate through the pages in the report by either clicking on the pages listed below, or by using the keyword search tool below to find specific information within the annual report.-
 1
1 -
2
-
3
-
4
-
5
-
6
-
7
-
8
-
9
-
10
-
11
-
12
-
13
-
14
-
15
-
16
-
17
-
18
-
19
-
20
-
21
-
22
-
23
-
24
-
25
-
26
-
27
-
28
-
29
-
30
-
31
-
32
-
 33
33 -
 34
34 -
 35
35 -
 36
36 -
 37
37 -
 38
38 -
 39
39 -
 40
40 -
 41
41 -
 42
42 -
 43
43 -
 44
44 -
 45
45 -
 46
46 -
 47
47 -
 48
48 -
 49
49 -
 50
50 -
 51
51 -
 52
52 -
 53
53 -
54
-
55
-
56
-
57
-
58
-
59
-
60
-
61
-
62
-
63
-
64
-
65
-
66
-
67
-
68
-
69
-
70
-
71
-
72
-
73
-
74
-
75
-
76
-
77
-
78
-
79
-
80
-
81
-
82
-
83
-
84
-
85
-
86
-
87
-
88
-
89
-
90
-
91
-
92
-
93
-
94
-
95
-
96
-
97
-
98
-
99
-
100
-
101
-
102
-
103
-
104
-
105
-
106
-
107
-
108
-
109
-
110
-
111
-
112
-
113
-
114
-
115
-
116
-
117
-
118
-
119
-
120
-
121
-
122
-
123
-
124
-
125
-
126
-
127
-
128
-
129
-
130
-
131
 |
 |

37
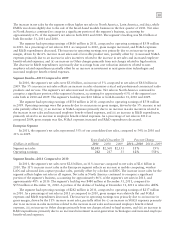
Results of Operations—2010 Compared to 2009
Net Sales
Net sales were $7.6 billion in 2010, an increase of 10% compared to net sales of $6.9 billion in 2009. The
increase in net sales reflects: (i) a $417 million, or 19%, increase in net sales in the Enterprise segment, and (ii) a
$253 million, or 5%, increase in net sales in the Government segment.
Gross Margin
Gross margin was $3.8 billion, or 50.0% of net sales, in 2010, compared to $3.5 billion, or 50.1% of net sales,
in 2009. Gross margin dollars increased in both segments, primarily driven by the increase in net sales. Gross
margin as a percent of sales was slightly lower in 2010, driven by a slight decrease in gross margin percentage in the
Enterprise segment, while gross margin as a percent of sales remained flat in the Government segment.
Selling, General and Administrative Expenses
SG&A expenses increased 13% to $1.9 billion, or 24.5% of net sales, in 2010, compared to $1.7 billion, or
23.9% of net sales, in 2009. SG&A expenses increased in both segments, primarily due to: (i) increased selling and
marketing expenses related to the increase in net sales, and (ii) increased employee benefit-related expenses. The
increases in employee benefit-related expenses are primarily due to: (i) an increase in pension-related expenses, and
(ii) the reinstatement of our 401(k) matching contributions in the third quarter of 2010.
Research and Development Expenditures
R&D expenditures increased 4% to $1.0 billion, or 13.6% of net sales, in 2010, compared to $1.0 billion, or
14.3% of net sales, in 2009. R&D expenditures as a percentage of net sales decreased in both segments. R&D
expenditures increased in both segments, primarily due to: (i) developmental engineering expenditures and
investment in next generation technologies, and (ii)increased employee benefit-related expenses.
Other Charges
We recorded net charges of $150 million in Other charges in 2010, compared to net charges of $255 million in
2009. The charges in 2010 included: (i) $203 million of charges relating to the amortization of intangibles, and
(ii) $54 million of net reorganization of business charges, partially offset by (i) $78 million of gains related to
intellectual property settlements and reserve adjustments, and (ii) $29 million of income related to a legal settlement.
The charges in 2009 included: (i) $218 million of charges relating to the amortization of intangibles, (ii) $88 million
of net reorganization of businesses, and (iii) $24 million of charges related to an environmental reserve, partially
offset by $75 million gain related to a legal settlement. The net reorganization of business charges are discussed in
further detail in the “Reorganization of Businesses” section.
Net Interest Expense
Net interest expense was $129 million in 2010, compared to net interest expense of $133 million in 2009. Net
interest expense in 2010 included interest expense of $217 million, partially offset by interest income of $88 million.
Net interest expense in 2009 includes interest expense of $207 million, partially offset by interest income of $74
million. The increase in net interest expense in 2010 compared to 2009 is primarily attributable to the absence of
reversals of interest expense accruals that were no longer needed as a result of the settlement of certain tax audits
during 2009, partially offset by increased interest income from long-term receivables.
Gains on Sales of Investments and Businesses
Gains on sales of investments and businesses were $49 million in 2010, compared to gains of $108 million in
2009. In 2010, the net gain was primarily comprised of a gain attributed to a single investment. In 2009, the net
gain primarily relates to sales of certain of our equity investments, of which $32 million of gain was attributed to a
single investment.
Other
Net Other expense was $7 million in 2010, compared to net Other income of $91 million in 2009. The net
expense in 2010 was primarily comprised of: (i) $21 million of investment impairments, and (ii) a $12 million loss