LensCrafters 2003 Annual Report Download - page 7
Download and view the complete annual report
Please find page 7 of the 2003 LensCrafters annual report below. You can navigate through the pages in the report by either clicking on the pages listed below, or by using the keyword search tool below to find specific information within the annual report.-
 1
1 -
 2
2 -
 3
3 -
 4
4 -
 5
5 -
 6
6 -
 7
7 -
 8
8 -
 9
9 -
 10
10 -
 11
11 -
 12
12 -
 13
13 -
 14
14 -
 15
15 -
 16
16 -
 17
17 -
 18
18 -
19
-
20
-
21
-
22
-
23
-
24
-
25
-
26
-
27
-
28
-
29
-
30
-
31
-
32
-
33
-
34
-
35
-
36
-
37
-
38
-
39
-
40
-
41
-
42
-
43
-
44
-
45
-
46
-
47
-
48
-
49
-
50
-
51
-
52
-
53
-
54
-
55
-
56
-
57
-
58
-
59
-
60
-
61
-
62
-
63
-
64
-
65
 |
 |
1312
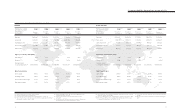
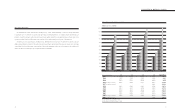
CONSOLIDATED FINANCIAL HIGHLIGHTS
2003
Thousands
of Euro
(5) (7) (9)
(6)
1999
Thousands of
U.S. Dollars
(5) (11)
(3) (6)
2000
Thousands of
U.S. Dollars
(5) (11)
(3) (6)
2001
Thousands of
U.S. Dollars
(5) (7) (11)
(3) (6)
2002
Thousands of
U.S. Dollars
(5) (7) (11)
(3) (6)
2003
Thousands of
U.S. Dollars
(5) (7) (9)
(3) (6)
(4)
(8) These figures have been retroactively adjusted to reflect the two-for-one stock split
which was effective June 26, 2000
(9) Figures for 2003 include results of OPSM Group’s operations from August 1, 2003
(10) Results through 2000 have been calculated from the financial statements in Lire
converted at the fixed rate of Lire 1,936.27 = 1.00
Net sales 1,889,047 2,438,728 3,101,129 3,178,602 2,824,636 Net sales 2,010,415 2,245,878 2,777,681 3,003,779 3,193,816
Gross profit 1,314,955 1,719,487 2,180,946 2,254,198 1.946,296 Gross profit 1,399,375 1,583,475 1,953,473 2,130,217 2,200,677
Operating income 237,658 411,921 509,492 601,508 431,787 Operating income 252,916 379,338 456,352 568,425 488,222
Income before taxes 228,061 362,019 441,311 539,441 389,793 Income before taxes 242,713 333,391 395,282 509,772 440,739
Net income 152,463 255,277 316,373 372,077 267,343 Net income 162,259 235,090 283,375 351,613 302,285
Figures per ordinary share (ADS) (2) Figures per ordinary share (ADS) (2)
Net earnings (8) 0.34 0.57 0.70 0.82 0.60 Net earnings (8) 0.36 0.52 0.63 0.78 0.67
Dividend (8) (10) 0.085 0.140 0.170 0.210 0.210 Dividend (8) (10) 0.081 0.120 0.165 - 0.210
Average number Average number
of outstanding shares (8) 449,299,800 449,987,899 451,036,978 453,174,041 448,664,413 of outstanding shares (8) 449,299,800 449,987,899 451,036,978 453,174,041 448,664,413
Main financial ratios Main financial ratios
Gross margin 69.6% 70.5% 70.3% 70.9% 68.9% Gross margin 69.6% 70.5% 70.3% 70.9% 68.9%
Operating margin 12.6% 16.9% 16.4% 18.9% 15.3% Operating margin 12.6% 16.9% 16.4% 18.9% 15.3%
Income before taxes margin 12.1% 14.8% 14.2% 17.0% 13.8% Income before taxes margin 12.1% 14.8% 14.2% 17.0% 13.8%
Net earnings margin 8.1% 10.5% 10.2% 11.7% 9.5% Net earnings margin 8.1% 10.5% 10.2% 11.7% 9.5%
1999-2003: FIVE-YEAR SELECTED FINANCIAL DATA
For the years ended
December 31, (1) (10)
(U.S. GAAP)
For the years ended
December 31, (1) (10)
(U.S. GAAP)
2000
Thousands
of Euro
(5) (11)
(6)
1999
Thousands
of Euro
(5) (11)
(6)
2001
Thousands
of Euro
(5) (7) (11)
(6)
2002
Thousands
of Euro
(5) (7) (11)
(6)
(1) Financial Statements in accordance with U.S. GAAP
(2) One ADS is equivalent to one ordinary share
(3) For the Euro/U.S. Dollar exchange rate on dividends please see page. 29
(4) Proposed by the Board of Directors and to be submitted for approval to the Annual
Shareholders’ Meeting on June 17, 2004
(5) 1999 through 2003 results include the activity of Ray-Ban from the
acquisition date (June 26, 1999)
(6) Except per ADS amounts which are in Euro and U.S. Dollars,
respectively
(7) Results for the 2001-2003 period include the activity of Sunglass Hut
International from the acquisition date (March 31, 2001)
(4) (4)
IN EURO IN U.S. DOLLARS
(11) These results have been adjusted to allow a comparison with results
for 2003
(12) OPSM’s results for 2003 include results of operations from August 1,
2003