LensCrafters 2003 Annual Report Download - page 45
Download and view the complete annual report
Please find page 45 of the 2003 LensCrafters annual report below. You can navigate through the pages in the report by either clicking on the pages listed below, or by using the keyword search tool below to find specific information within the annual report.-
 1
1 -
2
-
3
-
4
-
5
-
6
-
7
-
8
-
9
-
10
-
11
-
12
-
13
-
14
-
15
-
16
-
17
-
18
-
19
-
20
-
21
-
22
-
23
-
24
-
25
-
26
-
27
-
28
-
29
-
30
-
31
-
32
-
33
-
34
-
 35
35 -
 36
36 -
 37
37 -
 38
38 -
 39
39 -
 40
40 -
 41
41 -
 42
42 -
 43
43 -
 44
44 -
 45
45 -
 46
46 -
 47
47 -
 48
48 -
 49
49 -
 50
50 -
 51
51 -
 52
52 -
 53
53 -
 54
54 -
 55
55 -
56
-
57
-
58
-
59
-
60
-
61
-
62
-
63
-
64
-
65
 |
 |

8988
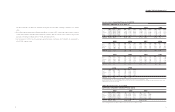
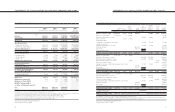
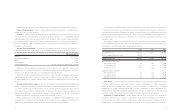
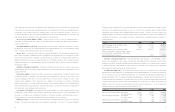
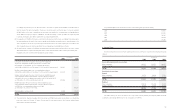
STATEMENTS OF CONSOLIDATED CASH FLOWS (*)
FOR THE YEARS ENDED DECEMBER 31,2001,2002 AND 2003
2001 2002 2003 2003
(Thousands (Thousands (Thousands (Thousands
of Euro) of Euro) of Euro) of U.S. Dollars (1))
CASH FLOWS FROM INVESTING ACTIVITIES
Property, plant and equipment:
• Additions (123,475) (173,330) (81,288) (102,398)
• Disposals 7,811 4,646 3,839 4,836
Purchases of business net of cash acquired (568,981) (27,428) (342,432) (431,362)
Increase in investments (2,718) (7,611) (501) (631)
(Increase) Decrease in intangible assets (23,714) 28,611 (48,177) (60,689)
Cash used in investing activities (711,077) (175,112) (468,559) (590,244)
CASH FLOWS FROM FINANCING ACTIVITIES
Long term debt:
• Proceeds 500,000 1,000,714 619,859 780,836
• Repayments (245,916) (1,408,308) (332,045) (418,277)
• Repayment of acquired line of credit (104,155) - - -
Use of restricted cash deposit 44,610 201,106 - -
Increase (Decrease) overdraft balances 259,083 (21,712) 156,290 196,879
Sales of treasury shares - 9,269 - -
Investment in treasury shares - (24,547) (45,440) (57,241)
Exercise of stock options 11,465 9,567 1,489 1,876
Dividends (63,326) (77,211) (95,405) (120,182)
Cash provided by (used in) financing activities 401,761 (311,122) 304,748 383,891
Increase (Decrease) in cash and cash equivalents 126,730 (46,061) 163,715 206,231
Cash and equivalents, beginning of year 85,392 199,202 151,418 190,741
Effect of exchange rate changes
on cash and cash equivalents (12,920) (1,723) (15,196) (19,142)
Cash and equivalents, end of year 199,202 151,418 299,937 377,831
Supplemental disclosure of cash flows information
• Cash paid during the year for interest 91,174 58,162 44,951 56,625
• Cash paid during the year for income taxes 126,833 137,650 110,609 139,334
• Acquisition of businesses:
Fair value of assets acquired (102,347) - 102,323 128,896
(1) Translated for convenience at the New York City Noon Buying Rate as determined in Note 1
See notes to Consolidated Financial Statements
(*) In accordance with U.S. GAAP
(**) In 2003, the Company determined that the net change in bank overdrafts had to be classified as financing activity rather
then netted against cash and cash equivalents. As a result, cash provided by (used in) financing activities and cash and
cash equivalents for previous years have been reclassified in the statements of consolidated cash flows from the amounts
previously reported to classify the net change in bank overdraft as a financing activity.
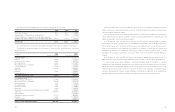
CASH FLOWS FROM
OPERATING ACTIVITIES
Net Income 316,373 372,077 267,343 336,771
Adjustments to reconcile net income to net
cash provided by (used in) operating activities:
• Minority interest in income of consolidated subsidiaries 1,488 4,669 5,122 6,452
• Depreciation and amortization 211,907 145,980 134,840 169,858
• Provision (Benefit) for deferred income taxes (15,983) (7,785) 12,865 16,206
• (Gain) Loss on disposals of fixed assets - net 1,764 (1,212) (124) (156)
• Termination indemnities matured during the year - net 2,886 5,977 2,403 3,027
Changes in assets and liabilities net
of acquisitions of businesses:
• Accounts receivable (56,021) (17,522) 23,888 30,092
• Prepaid expenses and other 8,012 56,339 (43,556) (54,867)
• Inventories (29,200) (58,573) 17,120 21,566
• Accounts payable (27,121) 8,926 (45,029) (56,723)
• Accrued expenses and other 29,506 (78,611) (39,857) (50,208)
• Accrual for customers' right of return 745 (3,147) (249) (314)
• Income taxes payable (8,310) 13,055 (7,240) (9,120)
Total adjustments 119,673 68,096 60,183 75,813
Cash provided by operating activities 436,046 440,173 327,526 412,584
(1) Translated for convenience at the New York City Noon Buying Rate as determined in Note 1
See notes to Consolidated Financial Statements
(*) In accordance with U.S. GAAP
(**) In 2003, the Company determined that the net change in bank overdrafts had to be classified as financing activity rather
then netted against cash and cash equivalents. As a result, cash provided by (used in) financing activities and cash and
cash equivalents for previous years have been reclassified in the statements of consolidated cash flows from the amounts
previously reported to classify the net change in bank overdraft as a financing activity.
STATEMENTS OF CONSOLIDATED CASH FLOWS (*)
FOR THE YEARS ENDED DECEMBER 31,2001,2002 AND 2003
2001(**)2002(**)2003 2003
(Thousands (Thousands (Thousands (Thousands
of Euro) of Euro) of Euro) of U.S. Dollars (1))