LensCrafters 2003 Annual Report Download - page 43
Download and view the complete annual report
Please find page 43 of the 2003 LensCrafters annual report below. You can navigate through the pages in the report by either clicking on the pages listed below, or by using the keyword search tool below to find specific information within the annual report.-
 1
1 -
2
-
3
-
4
-
5
-
6
-
7
-
8
-
9
-
10
-
11
-
12
-
13
-
14
-
15
-
16
-
17
-
18
-
19
-
20
-
21
-
22
-
23
-
24
-
25
-
26
-
27
-
28
-
29
-
30
-
31
-
32
-
 33
33 -
 34
34 -
 35
35 -
 36
36 -
 37
37 -
 38
38 -
 39
39 -
 40
40 -
 41
41 -
 42
42 -
 43
43 -
 44
44 -
 45
45 -
 46
46 -
 47
47 -
 48
48 -
 49
49 -
 50
50 -
 51
51 -
 52
52 -
 53
53 -
54
-
55
-
56
-
57
-
58
-
59
-
60
-
61
-
62
-
63
-
64
-
65
 |
 |

8584
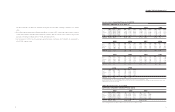
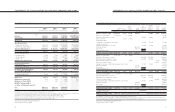
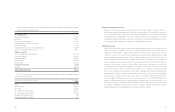
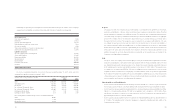
CONSOLIDATED BALANCE SHEETS (*)
DECEMBER 31,2002, AND 2003 (*)
ASSETS 2002 2003 2003
(Thousands of Euro) (Thousands of Euro) (Thousands
of U.S. Dollars)(1)
Current assets Notes
Cash and cash equivalents 1151,418 299,937 US$ 377,831
Accounts receivable
(Less allowance for doubtful accounts,
18.1 million in 2002, and 21.5 million
in 20032; U$ 27.1 million) 370,234 353,516 445,324
Sales and income taxes receivable 10,956 34,259 43,156
Inventories 3406,032 404,216 509,191
Prepaid expenses and other 53,385 50,714 63,884
Deferred tax assets 7148,088 124,451 156,771
Total current assets 1,140,113 1,267,093 1,596,157
Property, plant and equipment - net 2, 5 506,545 497,435 626,619
Other assets
Goodwill 61,244,660 1,328,914 1,674,033
Intangible assets - net 6671,866 764,698 963,290
Investments 412,837 13,055 16,445
Other assets 10,311 41,481 52,254
Total other assets 1,939,674 2,148,148 2,706,022
TOTAL 3,586,332 3,912,676 US$ 4,928,798
(1) Translated for convenience at the New York City Noon Buying Rate as determined in Note 1
See notes to Consolidated Financial Statements
(*) In accordance with U.S. GAAP
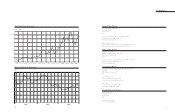
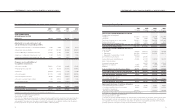
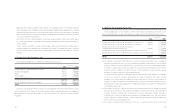
Current liabilities Notes
Bank overdrafts 371,729 516,905 US$ 651,145
Current portion of long-term debt 8178,335 390,935 492,461
Accounts payable 202,897 178,616 225,003
Accrued expenses
• Payroll and related 64,622 77,780 97,979
• Customers' right of return 9,130 7,423 9,351
• Other 153,262 140,608 177,124
Income taxes payable 718,748 11,011 13,870
Total current liabilities 998,723 1,323,278 1,666,933
Long term debt 8855,654 862,492 1,086,481
Liability for termination indemnities 948,945 47,241 59,509
Deferred tax liabilities 7121,805 161,102 202,940
Other long term liabilities 9133,605 124,157 156,401
Commitments and contingencies 14
Minority interests in consolidated subsidiaries 9,705 19,872 25,033
Shareholders' equity
Capital stock
Capital stock par value 0.06 - 454,263,600
and 454,477,033 ordinary shares authorized
and issued as of December 31, 2002, and 2003,
respectively; 452,351,900 and 448,042,247 shares
outstanding as of December 31, 2002, and 2003 11 27,256 27,269 34,351
Additional paid-in capital 34,799 36,275 45,696
Retained earnings 1,447,374 1,619,312 2,039,847
Accumulated other comprehensive
income (loss) net of tax 1(66,987) (238,335) (300,231)
Total 1,442,442 1,444,521 1,819,663
Less treasury shares at cost
1,911,700 and 6,434,786 shares
as of December 31, 2002 and 2003 respectively 24,547 69,987 88,163
Shareholders’ equity 1,417,895 1,374,534 1,731,500
TOTAL 3,586,332 3,912,676 US$ 4,928,798
(1) Translated for convenience at the New York City Noon Buying Rate as determined in Note 1
See notes to Consolidated Financial Statements
(*) In accordance with U.S. GAAP
2002 2003 2003
(Thousands of Euro) (Thousands of Euro) (Thousands
of U.S. Dollars) (1)
LIABILITIES AND
SHAREHOLDERS’ EQUITY