LensCrafters 2003 Annual Report Download - page 44
Download and view the complete annual report
Please find page 44 of the 2003 LensCrafters annual report below. You can navigate through the pages in the report by either clicking on the pages listed below, or by using the keyword search tool below to find specific information within the annual report.-
 1
1 -
2
-
3
-
4
-
5
-
6
-
7
-
8
-
9
-
10
-
11
-
12
-
13
-
14
-
15
-
16
-
17
-
18
-
19
-
20
-
21
-
22
-
23
-
24
-
25
-
26
-
27
-
28
-
29
-
30
-
31
-
32
-
33
-
 34
34 -
 35
35 -
 36
36 -
 37
37 -
 38
38 -
 39
39 -
 40
40 -
 41
41 -
 42
42 -
 43
43 -
 44
44 -
 45
45 -
 46
46 -
 47
47 -
 48
48 -
 49
49 -
 50
50 -
 51
51 -
 52
52 -
 53
53 -
 54
54 -
55
-
56
-
57
-
58
-
59
-
60
-
61
-
62
-
63
-
64
-
65
 |
 |

8786
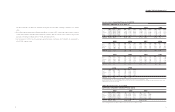
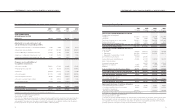
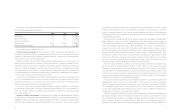
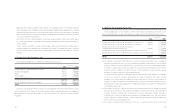
Balances, January 1, 2001 451,582,300 23,322 10,766 899,461 117,948 (2,334) 1,049,163
Exercise of stock options
1,283,517 71 11,394 11,465
Translation adjustment, net of taxes 40,486 40,486 40,486
Euro Conversion 3,779 (3,779)
Cummulative effect
of SFAS No. 133 adoption, net of taxes (7,749) (7,749) (7,749)
Change in fair value of
derivative instruments, net of taxes (3,569) (3,569) (3,569)
Dividends declared
(63,326) (63,326)
Net income
316,373 316,373 316,373
Comprehensive income
345,541
Balances, december 31, 2001 452,865,817 27,172 18,381 1,152,508 147,116 (2,334) 1,342,843
Exercise of stock options
1,397,783 84 9,483 9,567
Translation adjustment, net of taxes
(198,463) (198,463) (198,463)
Minimum pension liability, net of taxes (26,569) (26,569) (26,569)
Sale of treasury shares, net of taxes 6,935 2,334 9,269
Purchase of treasury shares (24,547) (24,547)
Change in fair value of derivative instruments, net of taxes 10,929 10,929 10,929
Dividends declared (77,211) (77,211)
Net Income (2)
372,077 372,077 372,077
Comprehensive Income
157,974
Balances, december 31, 2002 454,263,600 27,256 34,799 1,447,374 (66,987) (24,547) 1,417,895
Exercise of stock options
213,433 13 1,476 1,489
Translation adjustment, net of taxes
(169,053) (169,053) (169,053)
Minimum pension liability, net of taxes (1,228) (1,228) (1,228)
Purchase of treasury shares (45,440) (45,440)
Change in fair value of derivative instruments, net of taxes (1,067) (1,067) (1,067)
Dividends declared (95,405) (95,405)
Net income (2)
267,343 267,343 267,343
Comprehensive income
95,995
Balances, december 31, 2003 454,477,033 27,269 36,275 1,619,312 (238,335) (69,987) 1,374,534
Comprehensive income (1) US$ 120,925
(Thousands of U.S. Dollars)
Balances, December 31, 2003 454,477,033 US$ 34,351 US$ 45,696 US$ 2,039,847 US$ (300,231) US$ (88,163) US$ 1,731,500
(Thousands of U.S. Dollars)(1)
(1) Translated for convenience at the New York City Noon Buying Rate as determined in Note 1
(2) Results for the years ended December 31, 2002, and 2003, include the effect of the adoption of SFAS No. 142. For comparison among the fiscal years ended
December 31, 2001, 2002, and 2003, on a pro-forma basis see Note 1 “Goodwill and Change in Accounting”
See notes to Consolidated Financial Statements
(*) In accordance with U.S. GAAP
FOR THE YEARS ENDED DECEMBER 31,2001, 2002 AND 2003
Common Stock
Shares Amount
(Thousands of Euro)
Additional
Paid-in
Capital
Retained
Earnings
Other
Comprehensive
Income (Loss)
Net of Tax
Accumulated
Other
Comprehensive
Income (Loss)
Net of Tax
Treasury
Shares
Amount,
at Cost
Consolidated
Shareholders’
Equity
(Note 11)
STATEMENTS OF CONSOLIDATED SHAREHOLDERS’ EQUITY (*)
Notes
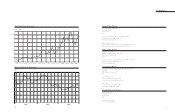
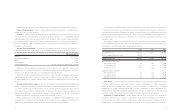
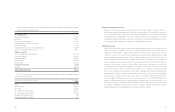
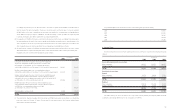
Net sales 12 3,101,129 3,178,602 2,824,636 US$ 3,558,194
Cost of sales (920,183) (924,404) (878,340) (1,106,445)
Gross profit 2,180,946 2,254,198 1,946,296 2,451,749
Operating expenses
• Selling and advertising (1,302,383) (1,358,884) (1,233,476) (1,553,810)
• General and administrative (369,071) (293,806) (281,033) (354,017)
Total operating expenses (1,671,454) (1,652,690) (1,514,509) (1,907,828)
Income from operations 12 509,492 601,508 431,787 543,921
Other income (expenses):
• Interest income 15,060 5,036 5,922 7,460
• Interest expense (91,978) (65,935) (47,117) (59,353)
• Other - net 8,737 (1,167) (799) (1,007)
Other income (expense) net (68,181) (62,066) (41,994) (52,900)
Income before provision
for income taxes 441,311 539,442 389,793 491,021
Provision for income taxes 7(123,450) (162,696) (117,328) (147,798)
Income before minority interests 317,861 376,746 272,465 343,223
in consolidated subsidiaries
Minority interests in income of
consolidated subsidiaries (1,488) (4,669) (5,122) (6,452)
Net income 316,373 372,077 267,343 US$ 336,771
Earnings per share: basic 0.70 0.82 0.60 0.75
Earnings per share: diluted 0.70 0.82 0.59 0.75
Weighted average number
of shares outstanding (thousands)(2):
Basic 451,037.0 453,174.0 448,664.4
Diluted 453,965.5 455,353.5 450,202.1
(1) Translated for convenience at the New York City Noon Buying Rate as determined in Note 1
(2) Results for the years ended December 31, 2002, and 2003, include the effect of the adoption of SFAS No.142. For comparison among the fiscal
years ended December 31, 2001, 2002, and 2003, on a pro-forma basis see Note 1 “Goodwill and Change in Accounting”
(3) Results for fiscal year 2001 include the results of operations of Sunglass Hut International from March 31, 2001
(4) Results for fiscal years 2001 and 2002 have been reclassified to allow for comparison with results for fiscal 2003
(5) Results for fiscal year 2003 include the results of operations of OPSM from August 1, 2003
See notes to Consolidated Financial Statements
(*) In accordance with U.S. GAAP
FOR THE YEARS ENDED DECEMBER 31,2001, 2002 AND 2003
2001(3)(4) 2002(2)(4) 2003(2)(5) 2003(2)(5)
(Thousands of Euro)(Thousands of Euro) (Thousands of Euro) (Thousands
of U.S. Dollars) (1)
STATEMENTS OF CONSOLIDATED INCOME AND EARNINGS PER SHARE (*)