LensCrafters 2003 Annual Report Download - page 40
Download and view the complete annual report
Please find page 40 of the 2003 LensCrafters annual report below. You can navigate through the pages in the report by either clicking on the pages listed below, or by using the keyword search tool below to find specific information within the annual report.-
 1
1 -
2
-
3
-
4
-
5
-
6
-
7
-
8
-
9
-
10
-
11
-
12
-
13
-
14
-
15
-
16
-
17
-
18
-
19
-
20
-
21
-
22
-
23
-
24
-
25
-
26
-
27
-
28
-
29
-
 30
30 -
 31
31 -
 32
32 -
 33
33 -
 34
34 -
 35
35 -
 36
36 -
 37
37 -
 38
38 -
 39
39 -
 40
40 -
 41
41 -
 42
42 -
 43
43 -
 44
44 -
 45
45 -
 46
46 -
 47
47 -
 48
48 -
 49
49 -
 50
50 -
51
-
52
-
53
-
54
-
55
-
56
-
57
-
58
-
59
-
60
-
61
-
62
-
63
-
64
-
65
 |
 |
7978
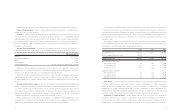
Lire 46,275,000,000. The ADS ratio remained unchanged, with each ADS continuing to represent one ordinary
share.
• At the Extraordinary Shareholders’ Meeting held in Milan on June 26, 2001, shareholders approved the conversion
of the Luxottica Group’s authorized and issued share capital into Euro. As a result of the conversion, the per share
par value of the Group’s ordinary shares is 0.06, from Italian Lire 100.
• On December 31, 2003, Luxottica Group’s authorized share capital was 27,268,621.98, equivalent to
454,477,033 ordinary shares.
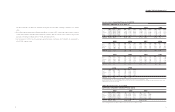
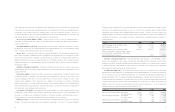
1990-2003:FOURTEEN YEARS ON THE NYSE
2001-2003:THREE YEARS ON THE MTA
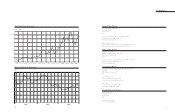
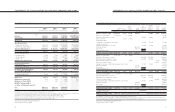
QUARTERLY ORDINARY SHARES PRICES (Euro)
QUARTERLY ADS PRICES (U.S. Dollars) (1)
1996
High Low Close
7.83 5.63 7.81
8.10 6.91 7.34
7.64 6.51 7.28
7.23 5.21 5.21
8.10 5.21
1997
High Low Close
6.64 5.13 5.31
6.99 5.30 6.78
6.98 5.63 5.69
6.51 5.68 6.25
6.99 5.13
1998
High Low Close
9.41 6.28 9.37
9.49 7.75 7.75
8.66 4.97 5.19
6.00 3.88 6.00
9.49 3.88
First
Second
Third
Fourth
Full Year
1999
High Low Close
6.66 5.00 6.44
8.63 6.19 7.78
9.53 7.00 9.53
10.31 7.81 8.78
10.31 5.00
First
Second
Third
Fourth
Full Year
2001
High Low Close
16.09 13.13 15.17
16.00 13.25 16.00
17.99 12.15 13.99
17.21 13.45 16.48
17.99 12.15
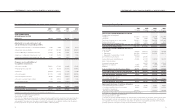
2003
High Low Close
14.05 10.23 10.95
14.11 10.69 13.90
15.48 13.73 14.29
18.15 14.40 17.40
18.15 10.23
2002
High Low Close
19.82 15.90 19.38
20.85 17.85 19.00
18.70 11.82 12.88
15.51 12.00 13.65
20.85 11.82
2000
High Low Close
12.34 7.97 12.25
12.97 11.19 12.19
17.00 12.38 16.13
16.44 13.00 13.75
17.00 7.97
1992
High Low Close
3.23 2.74 2.90
3.28 2.63 2.71
3.11 2.66 2.95
2.93 2.25 2.51
3.28 2.25
1991
High Low Close
1.41 0.99 1.38
1.71 1.39 1.51
2.28 1.51 2.26
2.75 2.25 2.75
2.75 0.99
1995
High Low Close
3.96 3.13 3.60
3.83 3.43 3.71
4.92 3.70 4.89
5.95 4.54 5.85
5.95 3.13
1994
High Low Close
3.38 2.79 3.04
3.50 2.98 3.41
3.58 3.28 3.39
3.65 3.23 3.41
3.65 2.79
1993
High Low Close
2.49 2.03 2.38
2.56 2.18 2.18
2.38 2.09 2.09
2.95 2.06 2.93
2.95 2.03
First
Second
Third
Fourth
Full Year
• Fourteen-year high: US$ 20.85 on April 26, 2002 • Fourteen years low: US$ 0.79 on November 7, 1990
(1) These figures have been retroactively adjusted to reflect the five-for-one stock split which was effective April 16, 1998, and the two-for-one stock
split which was effective June 26, 2000
1990
High Low Close
1.06 0.95 0.98
1.38 0.96 1.32
1.46 0.99 1.01
1.11 0.79 1.02
1.46 0.79
First
Second
Third
Fourth
Full Year
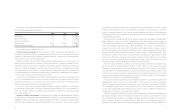
2003
High Low Close
13.48 9.25 9.81
12.37 9.85 11.92
13.96 11.67 12.23
14.82 12.35 13.70
14.82 9.25
First
Second
Third
Fourth
Full Year
2002
High Low Close
22.95 18.34 22.43
22.88 18.54 19.69
19.05 11.75 13.22
15.52 12.00 12.58
22.95 11.75
2001
High Low Close
17.20 14.37 16.80
19.11 15.04 19.11
20.62 13.41 15.74
19.59 14.88 18.43
20.62 13.41
• Three-year high: 22.95 on March 27, 2002 • Three-year low: 9.25 on March 12, 2003
SHARE PERFORMANCE