LensCrafters 2003 Annual Report Download - page 64
Download and view the complete annual report
Please find page 64 of the 2003 LensCrafters annual report below. You can navigate through the pages in the report by either clicking on the pages listed below, or by using the keyword search tool below to find specific information within the annual report.-
 1
1 -
2
-
3
-
4
-
5
-
6
-
7
-
8
-
9
-
10
-
11
-
12
-
13
-
14
-
15
-
16
-
17
-
18
-
19
-
20
-
21
-
22
-
23
-
24
-
25
-
26
-
27
-
28
-
29
-
30
-
31
-
32
-
33
-
34
-
35
-
36
-
37
-
38
-
39
-
40
-
41
-
42
-
43
-
44
-
45
-
46
-
47
-
48
-
49
-
50
-
51
-
52
-
53
-
 54
54 -
 55
55 -
 56
56 -
 57
57 -
 58
58 -
 59
59 -
 60
60 -
 61
61 -
 62
62 -
 63
63 -
 64
64 -
 65
65
 |
 |

126 127
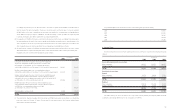
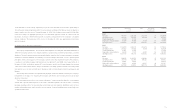
First Quarter Second Quarter Third Quarter (4) Fourth Quarter (4)
2003 2003 2003 2003
Net Sales 704,547 100% 706,955 100% 694,452 100% 718,682 100%
Gross Profit 496,531 70.5% 481,872 68.2% 474,695 68.4% 493,199 68.6%
Operating Income 111,351 15.8% 111,893 15.8% 109,429 15.8% 99,114 13.8%
Income before Taxes 95,853 13.6% 99,427 14.1% 107,295 15.5% 87,219 12.1%
Net Income 65,614 9.3% 67,669 9.6% 74,449 10.7% 59,613 8.3%
Earnings
per ADS in Euro 0.15 0.15 0.17 0.13
Earnings
per ADS in U.S. Dollars (1) 0.16 0.17 0.19 0.16
QUARTERLY FINANCIAL DATA
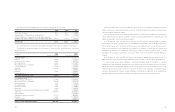
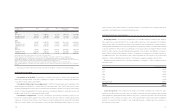
First Quarter (2) Second Quarter (2) Third Quarter (2) Fourth Quarter (2)
2002 2002 2002 2002
Net Sales 880,486 100% 879,003 100% 740,897 100% 678,215 100%
Gross Profit 622,240 70.7% 627,763 71.4% 525,563 70.9% 478,631 70.6%
Operating Income 163,185 18.6% 181,582 20.7% 142,376 19.2% 114,366 16.9%
Income before Taxes147,028 16.7% 159,807 18.2% 123,065 16.6% 109,541 16.2%
Net Income 101,070 11.5% 111,283 12.7% 85,370 11.5% 74,353 11.0%
Earnings per share
(ADS) in Euro 0.22 0.25 0.19 0.16
Earnings per share
(ADS) in U.S. Dollars (1) 0.20 0.23 0.19 0.16
(1) All U.S. Dollar amounts are translated at the Euro/U.S. Dollar average exchange rate of the relevant period (for further information see table on page 29)
(2) Results for fiscal year 2002 have been reclassified to allow for comparison with results for fiscal year 2003
(3) Except per ADS amounts which are in Euro and in U.S. Dollars
(4) Results for fiscal year 2003 include results of OPSM’s operations from August 1, 2003
(Thousands of Euro) (3)
(Thousands of Euro) (3)
QUARTERLY FINANCIAL DATA (U.S. GAAP)
(Subject to limited auditing review)
For the reader’s convenience the tables below set forth quarterly financial data for fiscal years 2002 and 2003.