LensCrafters 2003 Annual Report Download - page 17
Download and view the complete annual report
Please find page 17 of the 2003 LensCrafters annual report below. You can navigate through the pages in the report by either clicking on the pages listed below, or by using the keyword search tool below to find specific information within the annual report.-
 1
1 -
2
-
3
-
4
-
5
-
6
-
 7
7 -
 8
8 -
 9
9 -
 10
10 -
 11
11 -
 12
12 -
 13
13 -
 14
14 -
 15
15 -
 16
16 -
 17
17 -
 18
18 -
 19
19 -
 20
20 -
 21
21 -
 22
22 -
 23
23 -
 24
24 -
 25
25 -
 26
26 -
 27
27 -
28
-
29
-
30
-
31
-
32
-
33
-
34
-
35
-
36
-
37
-
38
-
39
-
40
-
41
-
42
-
43
-
44
-
45
-
46
-
47
-
48
-
49
-
50
-
51
-
52
-
53
-
54
-
55
-
56
-
57
-
58
-
59
-
60
-
61
-
62
-
63
-
64
-
65
 |
 |

33
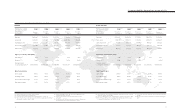
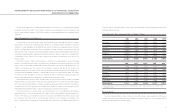
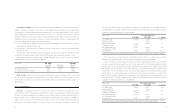
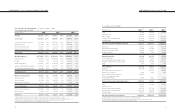
year was equal to US$ 41.7 million. The following table summarizes the combined effect on consolidated net sales of
exchange rates, the consolidation of OPSM’s results of operations and the 53rd week, as discussed above, to allow a
comparison of operating performance on a consistent basis:
(Millions of Euro) Consolidated Net Sales
FY 2002 FY 2003 % change
U.S. GAAP results 3,178.6 2,824.6 (11.1)
Exchange rate effect 400.2
Constant exchange rate 3,178.6 3,224.8 1.5
OPSM results in 2002 108.3
with OPSM in both years 3,286.9 3,224.8 (1.9)
w/o 53rd week in 2003(1) (44.1)
Consistent basis 3,286.9 3,180.7 (3.2)
(1) US$ 41.7 million converted in Euro at FY 2002 average exchange rate of 1.00 = US$ 0.9450 to maintain constant exchange rates comparison
The 3.2 percent year-over-year decrease in consolidated net sales for 2003 on a consistent basis was mainly
attributable to the termination in May of the Giorgio Armani and Emporio Armani license agreement.
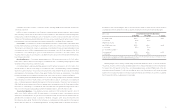
In 2003, net sales for Luxottica Group’s retail division accounted for approximately 70.9 percent of consolidated
net sales, compared with approximately 69.4 percent for 2002. Sales results for the Company’s retail division included
twelve months of sales at LensCrafters and Sunglass Hut International as well as sales at OPSM for the five-month
period August 1 through December 31, 2003. Net retail sales for 2003 declined year-over-year by 9.2 percent to
2,002.3 million, from 2,204.8 million for 2002. This decrease was primarily due to the weakening of the U.S. Dollar
against the Euro. At constant exchange rates, net retail sales for 2003 would have increased year-over-year by 6.8
percent. The following table summarizes the combined effect on the sales results of the Company’s retail division of
exchange rates, the consolidation of OPSM’s results of operations and the 53rd week, as discussed above, to allow a
comparison of operating performance on a consistent basis:
(Millions of Euro) Retail Segment Net Sales
FY 2002 FY 2003 % change
U.S. GAAP results 2,204.8 2,002.3 (9.2)
Exchange rate effect 351.8
Constant exchange rate 2,204.8 2,354.1 6.8
OPSM results in 2002(2) 109.8
with OPSM in both years 2,314.5 2,354.1 1.7
w/o 53rd week in 2003(1) (44.1)
Consistent basis 2,314.5 2,310.0 (0.2)
(1) US$ 41.7 million converted in Euro at FY 2002 average exchange rate of 1.00 = US$ 0.9450 to maintain constant exchange rates comparison
(2) This effect differs from the one relevant to consolidated net sales (108.3 million) because it is gross of inter-segment elimination
32
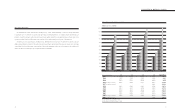
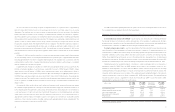
Consolidation of OPSM - The results of operations for the year ended December 31, 2003, include the results of
operations of OPSM as of August 1, 2003. Because of this significant change, Luxottica Group has included the
following table of consolidated adjusted sales and operating income for the year ended December 31, 2002. Luxottica
Group believes that the adjusted amounts may be of assistance in comparing Luxottica Group’s operating
performance between fiscal year 2002 and 2003. However, adjusted financial information should not be viewed as a
substitute for measures of performance calculated in accordance with generally accepted accounting principles. The
consolidated adjusted amounts reflect the following adjustments:
1. the consolidated results of OPSM for the five-month period ended December 31, 2002, prior to the acquisition,
are included in the adjusted amounts; and,
2. the elimination of wholesale sales to OPSM from Luxottica Group entities for the five-month period ended
December 31, 2002.
This information is being provided for comparison purposes only and does not purport to be indicative of the
actual results that would have been achieved had the OPSM acquisition been completed as of August 1, 2002.
The following table reflects Luxottica Group’s consolidated net sales and income from operations for the year
ended December 31, 2002, as reported and as adjusted:
(Millions of Euro) FY 2002 FY 2003
U.S. GAAP Adjustment Adjusted
Results for OPSM results
Consolidated net sales 3,178.6 108.3 3,286.9
Consolidated income from operations 601.5 6.1 607.6
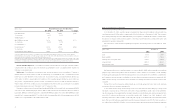
Retail calendar - Luxottica Group’s fiscal year for its retail operations ends on the Saturday closest to December
31, and, as a result, a 53rd week may be added every five to six years. Fiscal 2003 was such a year and, as a result,
the 53rd week has increased consolidated net sales of US$ 41.7 million and consolidated income from operations of
US$ 10.9 million.
RESULTS OF OPERATIONS
Net Sales - Consolidated net sales for fiscal year 2003 declined 11.1 percent to 2,824.6 million, from
3,178.6 million for 2002. This decrease was primarily due to the year-over-year weakening of the U.S. Dollar against
the Euro. At constant exchange rates, consolidated net sales for 2003 would have increased year-over-year by 1.5
percent. The year-over-year comparison was also affected by the consolidation of results of operations of OPSM as of
August 1, 2003, and also by the North American retail calendar, which in 2003 included a 53rd week (in 2002 the
North American retail calendar consisted of 52 weeks). The effect of the 53rd week on consolidated net sales for the