Kodak 2002 Annual Report Download - page 20
Download and view the complete annual report
Please find page 20 of the 2002 Kodak annual report below. You can navigate through the pages in the report by either clicking on the pages listed below, or by using the keyword search tool below to find specific information within the annual report.-
 1
1 -
2
-
3
-
4
-
5
-
6
-
7
-
8
-
9
-
 10
10 -
 11
11 -
 12
12 -
 13
13 -
 14
14 -
 15
15 -
 16
16 -
 17
17 -
 18
18 -
 19
19 -
 20
20 -
 21
21 -
 22
22 -
 23
23 -
 24
24 -
 25
25 -
 26
26 -
 27
27 -
 28
28 -
 29
29 -
 30
30 -
31
-
32
-
33
-
34
-
35
-
36
-
37
-
38
-
39
-
40
-
41
-
42
-
43
-
44
-
45
-
46
-
47
-
48
-
49
-
50
-
51
-
52
-
53
-
54
-
55
-
56
-
57
-
58
-
59
-
60
-
61
-
62
-
63
-
64
-
65
-
66
-
67
-
68
-
69
-
70
-
71
-
72
-
73
-
74
-
75
-
76
-
77
-
78
-
79
-
80
-
81
-
82
-
83
-
84
-
85
-
86
-
87
-
88
-
89
-
90
-
91
-
92
-
93
-
94
-
95
-
96
-
97
-
98
-
99
-
100
-
101
-
102
-
103
-
104
-
105
-
106
-
107
-
108
-
109
-
110
-
111
-
112
-
113
-
114
-
115
-
116
-
117
-
118
-
119
-
120
-
121
-
122
-
123
-
124
 |
 |

Financials
20
The decrease in worldwide net sales was primarily
attributable to a decrease in optics revenues of 39% and a
decrease in revenues due to the divestment of the Eastman
Software business in 2000. These decreases were partially offset
by a 10% increase in the sale of sensors.
In December 2001, the Company and SANYO announced the
formation of a business venture, SK Display Corporation, to
manufacture and sell active matrix organic light emitting diode
(OLED) displays for consumer devices. Kodak holds a 34%
ownership interest in this venture. For 2001, there were no sales
relating to this business. In the future, the Company will derive
revenue through royalty income and sales of raw materials and
finished displays.
Loss from continuing operations before interest, other
(charges) income, and income taxes increased $49 million from a
loss of $11 million in 2000 to a loss of $60 million in 2001. The
increase in the loss was attributable to increased costs incurred
for the continued development of the OLED technology, the
establishment of the SK Display business venture and costs
incurred to grow the existing optics and sensor businesses.
The Company’s results as noted above include certain one-
time items, such as charges associated with focused cost
reductions and other special charges. These one-time items,
which are described below, should be considered to better
understand the Company’s results of operations that were
generated from normal operational activities.
2002
The Company’s results from continuing operations for the year
included the following:
Charges of $114 million ($80 million after tax) related to
focused cost reductions implemented in the third and fourth
quarters. See further discussion in the Restructuring Costs and
Other section of Management’s Discussion and Analysis of
Financial Condition and Results of Operations (MD&A) and Note
14, “Restructuring Costs and Other.”
Charges of $50 million ($34 million after tax) related to
venture investment impairments and other asset write-offs
incurred in the second, third and fourth quarters. See MD&A and
Note 6, “Investments” for further discussion of venture investment
impairments.
Income tax benefits of $121 million, including a $45 million
tax benefit related to the closure of the PictureVision subsidiary
in the second quarter, a $46 million benefit from the loss realized
on the liquidation of a Japanese photofinishing operations
subsidiary in the third quarter, an $8 million benefit from a
fourth quarter property donation, and a $22 million adjustment to
reduce the Company’s income tax provision due to a decrease in
the estimated effective tax rate for the full year.
Excluding the above items, net earnings from continuing
operations were $787 million, or $2.70 per basic and diluted
share.
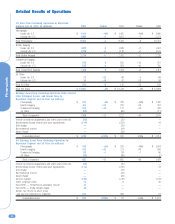
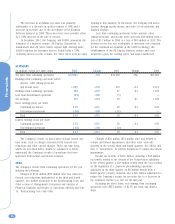
SUMMARY
(in millions, except per share data) 2002 Change 2001 Change 2000
Net sales from continuing operations $ 12,835 –3% $13,229 –5% $13,994
Earnings from continuing operations before
interest, other (charges) income,
and income taxes 1,220 +247 352 –84 2,214
Earnings from continuing operations 793 +879 81 –94 1,407
Loss from discontinued operations (23) –360 (5) —
Net earnings 770 +913 76 –95 1,407
Basic earnings (loss) per share
Continuing operations 2.72 +871 .28 –94 4.62
Discontinued operations (.08) –300 (.02) —
Total 2.64 +915 .26 –94 4.62
Diluted earnings (loss) per share
Continuing operations 2.72 +871 .28 –94 4.59
Discontinued operations (.08) –300 (.02) —
Total 2.64 +915 .26 –94 4.59