Kodak 2002 Annual Report Download - page 10
Download and view the complete annual report
Please find page 10 of the 2002 Kodak annual report below. You can navigate through the pages in the report by either clicking on the pages listed below, or by using the keyword search tool below to find specific information within the annual report.-
 1
1 -
 2
2 -
 3
3 -
 4
4 -
 5
5 -
 6
6 -
 7
7 -
 8
8 -
 9
9 -
 10
10 -
 11
11 -
 12
12 -
 13
13 -
 14
14 -
 15
15 -
 16
16 -
 17
17 -
 18
18 -
 19
19 -
 20
20 -
 21
21 -
22
-
23
-
24
-
25
-
26
-
27
-
28
-
29
-
30
-
31
-
32
-
33
-
34
-
35
-
36
-
37
-
38
-
39
-
40
-
41
-
42
-
43
-
44
-
45
-
46
-
47
-
48
-
49
-
50
-
51
-
52
-
53
-
54
-
55
-
56
-
57
-
58
-
59
-
60
-
61
-
62
-
63
-
64
-
65
-
66
-
67
-
68
-
69
-
70
-
71
-
72
-
73
-
74
-
75
-
76
-
77
-
78
-
79
-
80
-
81
-
82
-
83
-
84
-
85
-
86
-
87
-
88
-
89
-
90
-
91
-
92
-
93
-
94
-
95
-
96
-
97
-
98
-
99
-
100
-
101
-
102
-
103
-
104
-
105
-
106
-
107
-
108
-
109
-
110
-
111
-
112
-
113
-
114
-
115
-
116
-
117
-
118
-
119
-
120
-
121
-
122
-
123
-
124
 |
 |

Financials
10
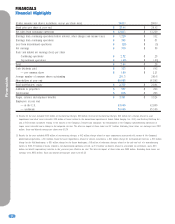
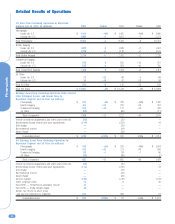
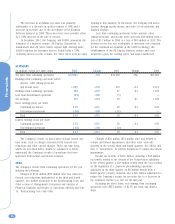
Net Sales from Continuing Operations by Reportable
Segment and All Other (in millions) 2002 Change 2001 Change 2000
Photography
Inside the U.S $ 4,034 –10% $ 4,482 –10% $ 4,960
Outside the U.S. 4,968 +1 4,921 –7 5,271
Total Photography 9,002 –4 9,403 –8 10,231
Health Imaging
Inside the U.S. 1,088 0 1,089 +2 1,067
Outside the U.S 1,186 +1 1,173 +2 1,153
Total Health Imaging 2,274 +1 2,262 +2 2,220
Commercial Imaging
Inside the U.S 818 0 820 +15 715
Outside the U.S. 638 +1 634 –10 702
Total Commercial Imaging 1,456 0 1,454 +3 1,417
All Other
Inside the U.S. 53 –22 68 0 68
Outside the U.S. 50 +19 42 –28 58
Total All Other 103 –6 110 –13 126
Total Net Sales $ 12,835 –3% $ 13,229 –5% $ 13,994
Earnings (Loss) from Continuing Operations Before Interest,
Other (Charges) Income, and Income Taxes by
Reportable Segment and All Other (in millions)
Photography $ 771 –2% $ 787 –45% $ 1,430
Health Imaging 431 +33 323 –38 518
Commercial Imaging 192 +12 172 –26 233
All Other (28) (60) (11)
Total of segments 1,366 +12 1,222 –44 2,170
Venture investment impairments and other asset write-offs (32) (12) —
Restructuring (costs) credits and asset impairments (114) (720) 44
Wolf charge —(77) —
Environmental reserve —(41) —
Kmart charge —(20) —
Consolidated total $ 1,220 +247% $ 352 –84% $ 2,214
Net Earnings (Loss) From Continuing Operations by
Reportable Segment and All Other (in millions)
Photography $ 550 +3% $ 535 –48% $ 1,034
Health Imaging 313 +42 221 –38 356
Commercial Imaging 83 –1 84 –7 90
All Other (23) (38) (2)
Total of segments 923 +15 802 –46 1,478
Venture investment impairments and other asset write-offs (50) (15) —
Restructuring (costs) credits and asset impairments (114) (720) 44
Wolf charge —(77) —
Environmental reserve —(41) —
Kmart charge —(20) —
Interest expense (173) (219) (178)
Other corporate items 14 8 26
Tax benefit — PictureVision subsidiary closure 45 ——
Tax benefit — Kodak Imagex Japan 46 ——
Income tax effects on above items
and taxes not allocated to segments 102 363 37
Consolidated total $ 793 +879% $ 81 –94% $ 1,407
Detailed Results of Operations