Kodak 2002 Annual Report Download - page 19
Download and view the complete annual report
Please find page 19 of the 2002 Kodak annual report below. You can navigate through the pages in the report by either clicking on the pages listed below, or by using the keyword search tool below to find specific information within the annual report.-
 1
1 -
2
-
3
-
4
-
5
-
6
-
7
-
8
-
 9
9 -
 10
10 -
 11
11 -
 12
12 -
 13
13 -
 14
14 -
 15
15 -
 16
16 -
 17
17 -
 18
18 -
 19
19 -
 20
20 -
 21
21 -
 22
22 -
 23
23 -
 24
24 -
 25
25 -
 26
26 -
 27
27 -
 28
28 -
 29
29 -
30
-
31
-
32
-
33
-
34
-
35
-
36
-
37
-
38
-
39
-
40
-
41
-
42
-
43
-
44
-
45
-
46
-
47
-
48
-
49
-
50
-
51
-
52
-
53
-
54
-
55
-
56
-
57
-
58
-
59
-
60
-
61
-
62
-
63
-
64
-
65
-
66
-
67
-
68
-
69
-
70
-
71
-
72
-
73
-
74
-
75
-
76
-
77
-
78
-
79
-
80
-
81
-
82
-
83
-
84
-
85
-
86
-
87
-
88
-
89
-
90
-
91
-
92
-
93
-
94
-
95
-
96
-
97
-
98
-
99
-
100
-
101
-
102
-
103
-
104
-
105
-
106
-
107
-
108
-
109
-
110
-
111
-
112
-
113
-
114
-
115
-
116
-
117
-
118
-
119
-
120
-
121
-
122
-
123
-
124
 |
 |

Financials
19
volume of new digital capture equipment and systems placements,
compounded by short-term start-up reliability issues with the new
equipment.
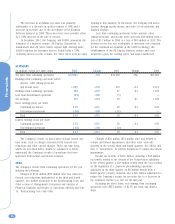
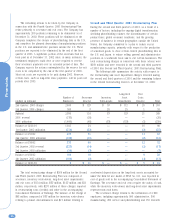
SG&A expenses for the Health Imaging segment increased
$16 million, or 4%, from $351 million in 2000 to $367 million in
2001. As a percentage of sales, SG&A increased from 15.8% in
2000 to 16.2% in 2001.
R&D expenses for the Health Imaging segment increased $14
million, or 10%, from $138 million in 2000 to $152 million in
2001. As a percentage of sales, R&D increased from 6.2% in
2000 to 6.7% in 2001.
Earnings from continuing operations before interest, other
(charges) income, and income taxes decreased $195 million, or
38%, from $518 million in 2000 to $323 million in 2001, which
is attributable to the decrease in the gross profit percentage in
2001 as compared with 2000, as described above.
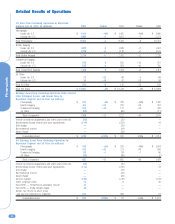
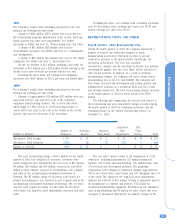
Commercial Imaging Net worldwide sales for the Commercial
Imaging segment were $1,454 million for 2001 as compared with
$1,417 million for 2000, representing an increase of $37 million,
or 3% as reported, or 5% excluding the negative net impact of
exchange.
Net sales in the U.S. were $820 million for 2001 as
compared with $715 million for 2000, representing an increase of
$105 million, or 15%. Net sales outside the U.S. were $634
million for 2001 as compared with $702 million for 2000,
representing a decrease of $68 million, or 10% as reported, or
5% excluding the negative impact of exchange.
Net worldwide sales of document imaging equipment,
products and services increased 8% in 2001 as compared with
2000. The increase in sales was primarily attributable to an
increase in service revenue due to the acquisition of the Bell and
Howell Imaging business in the first quarter of 2001. With the
acquisition of the Bell and Howell Imaging business, the Company
continues to secure new exclusive third-party maintenance
agreements. The increase in revenue was also due to strong
demand for the Company’s iNnovation series scanners, specifically
the new i800 series high-volume document scanner.
Net worldwide sales of the Company’s commercial and
government products and services increased 16% in 2001 as
compared with 2000. The increase in sales was principally due to
an increase in revenues from government products and services
under its government contracts.
Net worldwide sales for wide-format inkjet products were a
contributor to the net increase in Commercial Imaging sales as
these revenues increased 9% in 2001 as compared with 2000,
reflecting year-over-year sales increases throughout 2001. The
Company continues to focus on initiatives to grow this business
as reflected in the acquisition of ENCAD, Inc. in January of 2002.
Given ENCAD’s strong distribution position in this industry, the
acquisition of ENCAD is expected to provide the Company with an
additional channel to the inkjet printer market.
Net worldwide sales of graphic arts products to KPG
decreased 15% in 2001 as compared with 2000. The largest
contributor to this decline in sales was graphics film, which
experienced a 20% decrease, reflecting a 19% decrease in
volume and small declines attributable to price/mix and exchange.
The decrease in sales to KPG is attributable to continued
technology substitution and economic weakness. During 2001,
KPG continued to implement the operational improvements it
began in 2000, which returned the joint venture to profitability in
the first quarter and throughout 2001. In the fourth quarter of
2001, KPG completed its acquisition of Imation’s color proofing
and software business. The Company believes that Imation’s
portfolio of products will complement and expand KPG’s offerings
in the marketplace, which should drive sell-through of Kodak’s
graphics products. The Company is the exclusive provider of
graphic arts products to KPG. Net earnings from continuing
operations include positive earnings from the Company’s equity in
the income of KPG.
Net worldwide sales of products to NexPress decreased in
2001 as compared with 2000, reflecting a 15% decrease in
volume and declines in price/mix. In September 2001, the joint
venture achieved its key milestone in launching the NexPress
2100 printer product at the Print ‘01 trade show. There is strong
customer demand for the new printer, which the Company
believes should drive increased sell-through of Kodak’s products
through the joint venture.
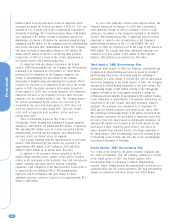
Gross profit for the Commercial Imaging segment was $451
million for 2001 compared with $473 million for 2000,
representing a decrease of $22 million, or 5%. The gross profit
margin for the Commercial Imaging segment was 31.0% in 2001
as compared with 33.4% in 2000. The 2.4 percentage point
decrease in gross margin was primarily attributable to lower
selling prices in a number of product groups within the segment.
SG&A expenses for the Commercial Imaging segment
increased $32 million, or 18%, from $176 million in 2000, to
$208 million in 2001. As a percentage of sales, SG&A increased
from 12.4% in 2000 to 14.3% in 2001.
R&D costs for the Commercial Imaging segment decreased $3
million, or 5%, from $61 million in 2000 to $58 million in 2001.
As a percentage of sales, R&D decreased from 4.3% in 2000 to
4.0% in 2001.
Earnings from continuing operations before interest, other
(charges) income, and income taxes decreased $61 million, or
26%, from $233 million in 2000 to $172 million in 2001, which
was attributable to the decrease in the gross profit percentage
and an increase in SG&A expenses in 2001 as compared with
2000, as described above.
All Other Net worldwide sales of businesses comprising All
Other were $110 million for 2001 as compared with $126 million
for 2000, representing a decrease of $16 million, or 13% as
reported, with no impact from exchange. Net sales in the U.S.
were flat at $68 million for both 2001 and 2000, while net sales
outside the U.S. were $42 million for 2001 as compared with $58
million for 2000, representing a decrease of $16 million, or 28%
as reported, or 30% excluding the net impact of exchange.