Kodak 2002 Annual Report Download - page 11
Download and view the complete annual report
Please find page 11 of the 2002 Kodak annual report below. You can navigate through the pages in the report by either clicking on the pages listed below, or by using the keyword search tool below to find specific information within the annual report.-
 1
1 -
 2
2 -
 3
3 -
 4
4 -
 5
5 -
 6
6 -
 7
7 -
 8
8 -
 9
9 -
 10
10 -
 11
11 -
 12
12 -
 13
13 -
 14
14 -
 15
15 -
 16
16 -
 17
17 -
 18
18 -
 19
19 -
 20
20 -
 21
21 -
 22
22 -
23
-
24
-
25
-
26
-
27
-
28
-
29
-
30
-
31
-
32
-
33
-
34
-
35
-
36
-
37
-
38
-
39
-
40
-
41
-
42
-
43
-
44
-
45
-
46
-
47
-
48
-
49
-
50
-
51
-
52
-
53
-
54
-
55
-
56
-
57
-
58
-
59
-
60
-
61
-
62
-
63
-
64
-
65
-
66
-
67
-
68
-
69
-
70
-
71
-
72
-
73
-
74
-
75
-
76
-
77
-
78
-
79
-
80
-
81
-
82
-
83
-
84
-
85
-
86
-
87
-
88
-
89
-
90
-
91
-
92
-
93
-
94
-
95
-
96
-
97
-
98
-
99
-
100
-
101
-
102
-
103
-
104
-
105
-
106
-
107
-
108
-
109
-
110
-
111
-
112
-
113
-
114
-
115
-
116
-
117
-
118
-
119
-
120
-
121
-
122
-
123
-
124
 |
 |

Financials
11
2002 COMPARED WITH 2001
RESULTS OF OPERATIONS —
CONTINUING OPERATIONS
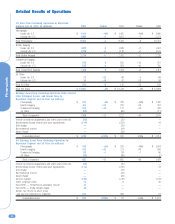
Consolidated Net worldwide sales were $12,835 million for
2002 as compared with $13,229 million for 2001, representing a
decrease of $394 million, or 3% as reported, with no net impact
from exchange. Declines in volume accounted for approximately
1.5 percentage points of the sales decrease, driven primarily by
volume decreases in traditional film and U.S. photofinishing
services. Declines in price/mix reduced sales for 2002 by
approximately 1.5 percentage points, driven primarily by
traditional consumer film products and health film and laser
imaging systems.
Net sales in the U.S. were $5,993 million for the current
year as compared with $6,459 million for the prior year,
representing a decrease of $466 million, or 7%. Net sales outside
the U.S. were $6,842 million for the current year as compared
with $6,770 million for the prior year, representing an increase
of $72 million, or 1% as reported, with no impact from exchange.
Net sales in the Europe, Asia, Africa, and Middle East
Region (EAMER) for 2002 were $3,491 million as compared with
$3,333 million for 2001, representing an increase of 5% as
reported, or 1% excluding the favorable impact of exchange. Net
sales in the Asia Pacific region for 2002 increased slightly from
$2,231 million for 2001 to $2,240 million for 2002, with no
impact from exchange. Net sales in the Canada and Latin
America region for 2002 were $1,111 million as compared with
$1,206 million for 2001, representing a decrease of 8% as
reported, or an increase of 6% excluding the negative impact of
exchange.
Net sales for Emerging Market countries were $2,425 million
for 2002 as compared with $2,371 million for 2001, representing
an increase of $54 million, or 2%. Sales growth in China and
Russia of 25% and 20%, respectively, were the primary drivers
of the increase in sales in Emerging Market countries, partially
offset by decreased sales in Argentina, Brazil and Mexico of 53%,
11% and 6%, respectively. The sales growth in China resulted
from strong business performance for health and consumer
products. The sales growth in Russia is a result of the expansion
of new channel operations for Kodak products and services and
continued success in camera seeding programs. The sales declines
in Argentina, Brazil and Mexico are reflective of the continued
economic weakness currently being experienced by many Latin
American emerging market countries. The emerging market
portfolio accounted for approximately 19% and 35% of the
Company’s worldwide and non-U.S. sales, respectively, in 2002.
Gross profit was $4,610 million for 2002 as compared with
$4,568 million for 2001, representing an increase of $42 million,
or 1%. The gross profit margin was 35.9% in the current year as
compared with 34.5% in the prior year. The increase of 1.4
percentage points was primarily attributable to manufacturing
productivity/cost, which favorably impacted gross profit margins
by approximately 2.7 percentage points year-over-year due to
reduced labor expense, favorable materials pricing and improved
product yields. This increase was also attributable to costs
associated with restructuring and the exit of an equipment
manufacturing facility incurred in 2001 but not in the current
year, which negatively impacted gross profit margins for 2001 by
approximately 1.0 percentage point. The positive impacts to gross
profit were partially offset by year-over-year price/mix declines,
which reduced gross profit margins by approximately 2.3
percentage points. The price/mix decreases were primarily related
to declining prices on consumer film, health laser imaging
systems and consumer color paper, and product shifts primarily
in the Photography segment.
Selling, general and administrative expenses (SG&A) were
$2,530 million for 2002 as compared with $2,625 million for
2001, representing a decrease of $95 million, or 4%. SG&A
decreased slightly as a percentage of sales from 19.8% for the
prior year to 19.7% for the current year. The net decrease in
SG&A is primarily attributable to the cost savings from the
employment reductions and other non-severance related
components of the Company’s focused cost reductions, offset by
acquisitions in the Photography and Commercial segments and
higher strategic venture investment impairments in 2002 when
compared with 2001 of $15 million.
Research and development (R&D) costs remained relatively
flat at $762 million for 2002 as compared with $779 million for
2001, representing a decrease of $17 million, or 2%. As a
percentage of sales, R&D costs also remained flat at 5.9% for
both the current and prior years.
Earnings from continuing operations before interest, other
(charges) income, and income taxes for 2002 were $1,220 million
as compared with $352 million for 2001, representing an
increase of $868 million, or 247%. The primary reason for the
increase in earnings from operations was a decrease in
restructuring costs and asset impairments of $586 million.
Results for 2002 also benefited from the savings associated with
restructuring programs implemented in 2001. In addition, results
for 2001 included charges of $138 million for the Wolf bankruptcy
charge, environmental reserve and Kmart bankruptcy, and
goodwill amortization charges of $153 million.
Interest expense for 2002 was $173 million as compared
with $219 million for 2001, representing a decrease of $46
million, or 21%. The decrease in interest expense is primarily
attributable to lower average borrowing levels and lower interest
rates in 2002 relative to 2001. Other charges for the current
year were a net charge of $101 million as compared with a net
charge of $18 million for the prior year. The increase in other
charges is primarily attributable to increased losses from the
Company’s NexPress and SK Display joint ventures as these
business ventures are in the early stages of bringing their
offerings to market, higher non-strategic venture investment