Kodak 2002 Annual Report Download - page 18
Download and view the complete annual report
Please find page 18 of the 2002 Kodak annual report below. You can navigate through the pages in the report by either clicking on the pages listed below, or by using the keyword search tool below to find specific information within the annual report.-
 1
1 -
2
-
3
-
4
-
5
-
6
-
7
-
 8
8 -
 9
9 -
 10
10 -
 11
11 -
 12
12 -
 13
13 -
 14
14 -
 15
15 -
 16
16 -
 17
17 -
 18
18 -
 19
19 -
 20
20 -
 21
21 -
 22
22 -
 23
23 -
 24
24 -
 25
25 -
 26
26 -
 27
27 -
 28
28 -
29
-
30
-
31
-
32
-
33
-
34
-
35
-
36
-
37
-
38
-
39
-
40
-
41
-
42
-
43
-
44
-
45
-
46
-
47
-
48
-
49
-
50
-
51
-
52
-
53
-
54
-
55
-
56
-
57
-
58
-
59
-
60
-
61
-
62
-
63
-
64
-
65
-
66
-
67
-
68
-
69
-
70
-
71
-
72
-
73
-
74
-
75
-
76
-
77
-
78
-
79
-
80
-
81
-
82
-
83
-
84
-
85
-
86
-
87
-
88
-
89
-
90
-
91
-
92
-
93
-
94
-
95
-
96
-
97
-
98
-
99
-
100
-
101
-
102
-
103
-
104
-
105
-
106
-
107
-
108
-
109
-
110
-
111
-
112
-
113
-
114
-
115
-
116
-
117
-
118
-
119
-
120
-
121
-
122
-
123
-
124
 |
 |

Financials
18
paper decreased 2% in 2001 as compared with 2000, reflecting a
4% increase in volume, offset by a 4% decrease in price and a
2% decline attributable to exchange.
Net worldwide sales of origination and print film to the
entertainment industry decreased 4% in 2001 as compared with
2000. Origination film sales decreased 12%, reflecting a 9%
decline in volume and a 3% decline due to the negative impact of
exchange. The decrease in origination film sales was partially
offset by an increase in print film of 4%, reflecting a 9%
increase in volume, offset by declines attributable to exchange
and price of 3% and 2%, respectively. After several consecutive
years of growth in origination film sales, this decrease reflects a
slight downward trend beginning in the second half of 2001 due
to continued economic weakness in the U.S., which caused a
decrease in television advertising spend and the resulting decline
in the production of television commercials. Additionally, the
events of September 11th caused a number of motion picture film
releases and television show productions to be delayed or
postponed.
Gross profit for the Photography segment was $3,402 million
in 2001 as compared with $4,099 million in 2000, representing a
decrease of $697 million or 17%. The gross profit margin for the
Photography segment was 36.2% in 2001 as compared with
40.1% in 2000. The 3.9 percentage point decrease in gross
margin for the Photography segment was primarily attributable to
continued lower effective selling prices across virtually all product
groups, including the Company’s core products of traditional film,
paper, and digital cameras, unfavorable exchange and flat
distribution costs on a lower sales base.
SG&A expenses for the Photography segment remained
relatively flat, decreasing $10 million, or 1%, from $1,973 million
in 2000 to $1,963 million in 2001. As a percentage of sales,
SG&A increased from 19.3% in 2000 to 20.9% in 2001. SG&A,
excluding advertising, increased 4%, representing 14.6% of sales
in 2001 and 12.9% of sales in 2000. R&D expenses for the
Photography segment decreased $33 million, or 6%, from $575
million in 2000 to $542 million in 2001. As a percentage of
sales, R&D increased slightly from 5.6% in 2000 to 5.8% in
2001.
Earnings from continuing operations before interest, other
(charges) income, and income taxes for the Photography segment
decreased $643 million, or 45%, from $1,430 million in 2000 to
$787 million in 2001, reflecting the lower sales and gross profit
levels described above.
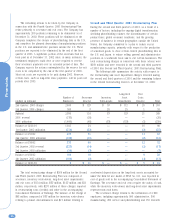
Health Imaging Net worldwide sales for the Health Imaging
segment were $2,262 million for 2001 as compared with $2,220
million for 2000, representing an increase of $42 million, or 2%
as reported, or a 5% increase excluding the negative net impact
of exchange.
Net sales in the U.S. were $1,089 million for 2001 as
compared with $1,067 million for 2000, representing an increase
of $22 million or 2%. Net sales outside the U.S. were $1,173
million for 2001 as compared with $1,153 million for 2000,
representing an increase of $20 million, or 2% as reported, or
7% excluding the negative impact of exchange. Sales in emerging
markets increased slightly, up 4% from 2000 to 2001.
Net worldwide sales of digital products, which include laser
imagers (DryView imagers and wet laser printers), digital media
(DryView and wet laser media), digital capture equipment
(computed radiography capture equipment and digital radiography
equipment) and PACS, increased 11% in 2001 as compared with
2000. The increase in digital sales was principally the result of a
184% increase in digital capture revenues resulting from a 201%
increase in volume, due to new product introductions in 2000 and
2001. In the second and third quarter of 2000, the Company
introduced new computer radiography and digital radiography
products. In 2001, the Company’s results include sales of these
products for the full year, as well as sales of newer Computed
Radiography products, which were launched in early 2001. The
increase in revenues was partially offset by declines attributable
to price and exchange. Laser imaging equipment, services and
film also contributed to the increase in digital sales, as sales in
these combined categories increased 3% in 2001 as compared
with 2000. The 3% increase in these product groups was the
result of increases in DryView laser imagers and media of 8%
and 33%, respectively, which were partially offset by the
expected decreases in wet laser printers and media of 8% and
29%, respectively, in 2001 as compared with 2000. Sales of
PACS increased 9% in 2001 as compared with 2000, reflecting a
16% increase in volume, partially offset by declines attributable
to price and exchange of 4% and 3%, respectively.
Net worldwide sales of traditional medical products, which
include analog film, equipment, chemistry and services, decreased
7% in 2001 as compared with 2000. This decline was primarily
attributable to a 12% decrease in non-specialty medical sales.
The decrease in these sales was partially offset by an increase in
specialty Mammography and Oncology sales, which increased 4%,
reflecting a 12% increase in volume, offset by declines
attributable to price/mix and exchange of 6% and 2%,
respectively. Additionally, Dental sales increased 3% in 2001 as
compared with 2000, reflecting a 5% increase in volume, which
was partially offset by declines of 1% attributable to both
price/mix and exchange.
Gross profit for the Health Imaging segment was $869
million for 2001 as compared with $1,034 million for 2000,
representing a decrease of $165 million or 16%. The gross profit
margin for the Health Imaging segment was 38.4% in 2001 as
compared with 46.6% in 2000. The 8.2 percentage point decrease
in gross margin was primarily attributable to selling price
declines in 2001, driven by the continued conversion of customers
to lower pricing levels under the Company’s Novation GPO
contracts and a larger product mix shift from higher margin
traditional analog film toward lower margin digital capture and
printing equipment. Additionally, in 2001 as compared with 2000,
the Company incurred higher service costs due to an increase in