Kodak 2002 Annual Report Download - page 120
Download and view the complete annual report
Please find page 120 of the 2002 Kodak annual report below. You can navigate through the pages in the report by either clicking on the pages listed below, or by using the keyword search tool below to find specific information within the annual report.-
 1
1 -
2
-
3
-
4
-
5
-
6
-
7
-
8
-
9
-
10
-
11
-
12
-
13
-
14
-
15
-
16
-
17
-
18
-
19
-
20
-
21
-
22
-
23
-
24
-
25
-
26
-
27
-
28
-
29
-
30
-
31
-
32
-
33
-
34
-
35
-
36
-
37
-
38
-
39
-
40
-
41
-
42
-
43
-
44
-
45
-
46
-
47
-
48
-
49
-
50
-
51
-
52
-
53
-
54
-
55
-
56
-
57
-
58
-
59
-
60
-
61
-
62
-
63
-
64
-
65
-
66
-
67
-
68
-
69
-
70
-
71
-
72
-
73
-
74
-
75
-
76
-
77
-
78
-
79
-
80
-
81
-
82
-
83
-
84
-
85
-
86
-
87
-
88
-
89
-
90
-
91
-
92
-
93
-
94
-
95
-
96
-
97
-
98
-
99
-
100
-
101
-
102
-
103
-
104
-
105
-
106
-
107
-
108
-
109
-
 110
110 -
 111
111 -
 112
112 -
 113
113 -
 114
114 -
 115
115 -
 116
116 -
 117
117 -
 118
118 -
 119
119 -
 120
120 -
 121
121 -
 122
122 -
 123
123 -
 124
124
 |
 |
Proxy Statement
115
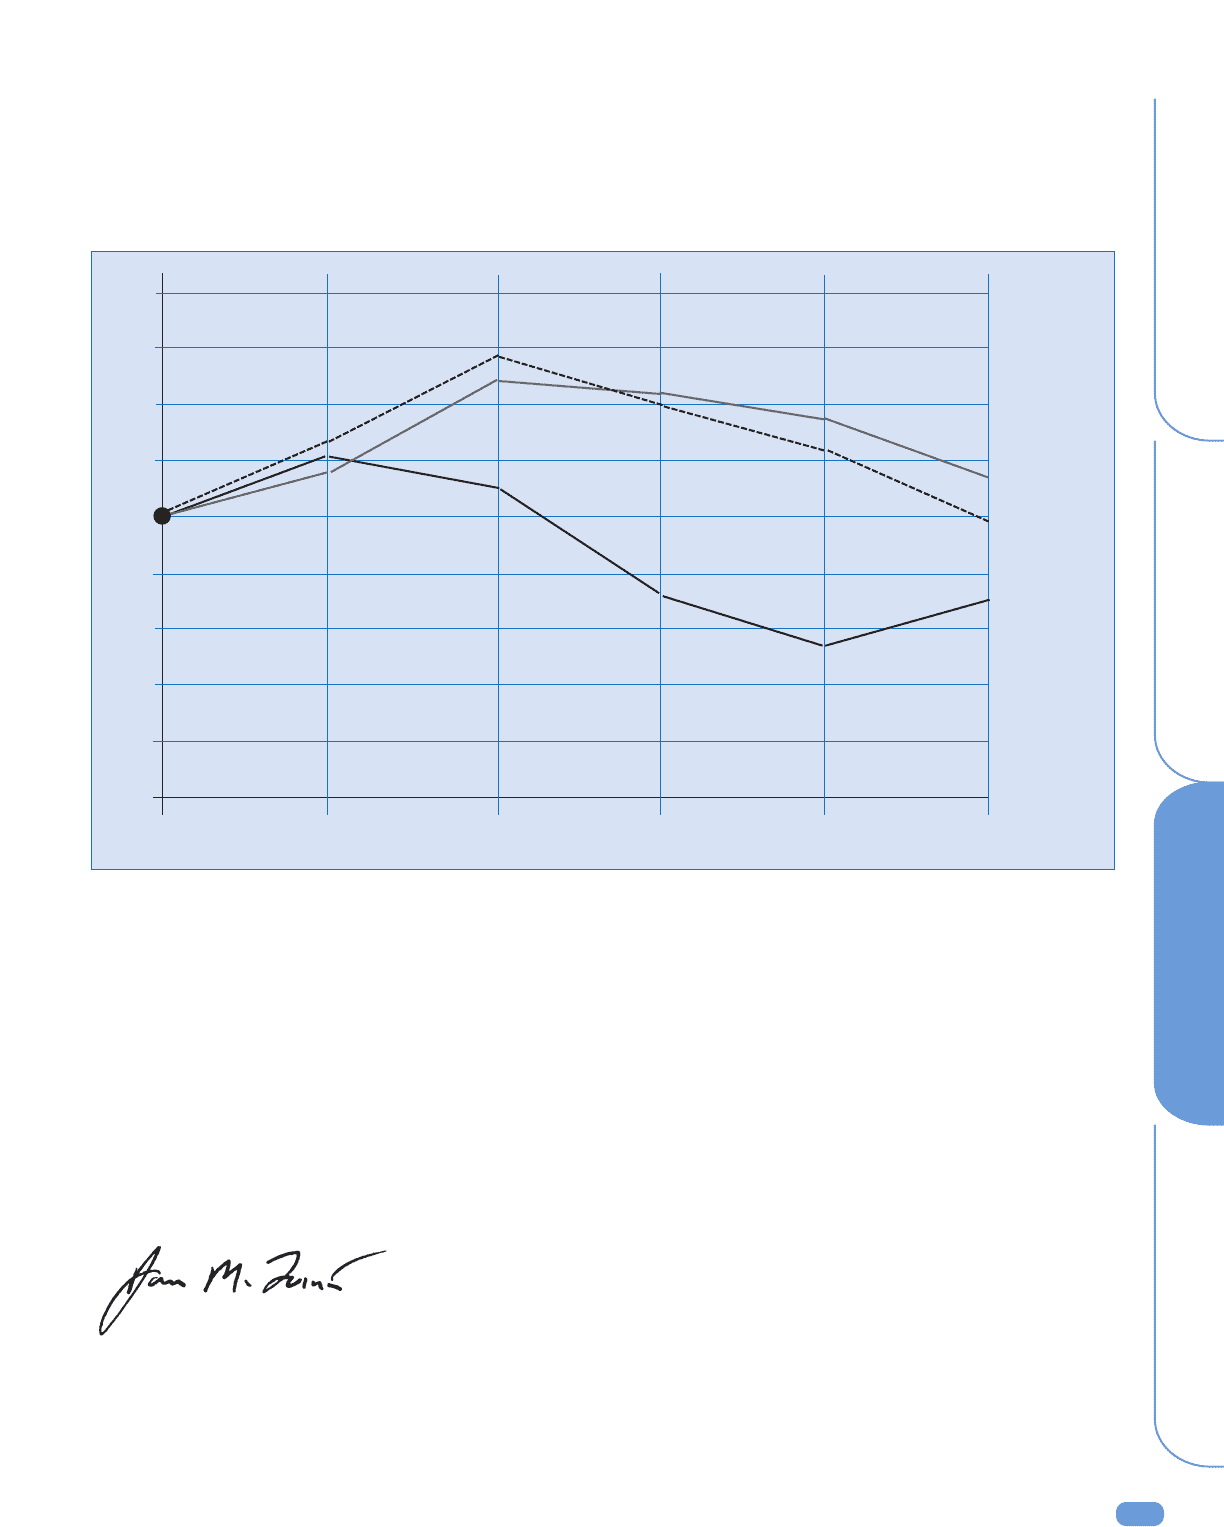
The graph assumes that $100 was invested on December 31, 1997, in each of the Company’s common stock, the Standard & Poor’s
500 Composite Stock Price Index and the Dow Jones Industrial Index, and that all dividends were reinvested. In addition, the graph
weighs the constituent companies on the basis of their respective market capitalizations, measured at the beginning of each relevant
time period.
By Order of the Board of Directors
James M. Quinn
Secretary and Assistant General Counsel
Eastman Kodak Company
March 28, 2003
Performance Graph — Shareholder Return
$ 180
$ 160
$ 140
$ 120
$ 100
$80
$60
$40
$20
$0
12/31/97 12/31/1998 12/31/1999 12/31/2000 12/31/2001 12/31/2002
◆
◆
◆
◆
◆
▲
▲
■
■■
■
■
The following graph compares the performance of the Company’s common stock with the performance of the Standard & Poor’s
500 Composite Stock Price Index and the Dow Jones Industrial Index, by measuring the changes in common stock prices from
December 31, 1997, plus assumed reinvested dividends.
◆
■
▲
▲
▲
▲
DJIA
S&P 500
EK