Kia 2005 Annual Report Download - page 96
Download and view the complete annual report
Please find page 96 of the 2005 Kia annual report below. You can navigate through the pages in the report by either clicking on the pages listed below, or by using the keyword search tool below to find specific information within the annual report.-
 1
1 -
2
-
3
-
4
-
5
-
6
-
7
-
8
-
9
-
10
-
11
-
12
-
13
-
14
-
15
-
16
-
17
-
18
-
19
-
20
-
21
-
22
-
23
-
24
-
25
-
26
-
27
-
28
-
29
-
30
-
31
-
32
-
33
-
34
-
35
-
36
-
37
-
38
-
39
-
40
-
41
-
42
-
43
-
44
-
45
-
46
-
47
-
48
-
49
-
50
-
51
-
52
-
53
-
54
-
55
-
56
-
57
-
58
-
59
-
60
-
61
-
62
-
63
-
64
-
65
-
66
-
67
-
68
-
69
-
70
-
71
-
72
-
73
-
74
-
75
-
76
-
77
-
78
-
79
-
80
-
81
-
82
-
83
-
84
-
85
-
 86
86 -
 87
87 -
 88
88 -
 89
89 -
 90
90 -
 91
91 -
 92
92 -
 93
93 -
 94
94 -
 95
95 -
 96
96 -
 97
97 -
 98
98 -
 99
99 -
 100
100 -
 101
101 -
 102
102 -
 103
103 -
 104
104 -
 105
105 -
 106
106 -
107
-
108
-
109
-
110
-
111
-
112
-
113
-
114
-
115
-
116
-
117
-
118
-
119
-
120
-
121
-
122
-
123
-
124
-
125
-
126
-
127
-
128
 |
 |

96
KIA MOTORS
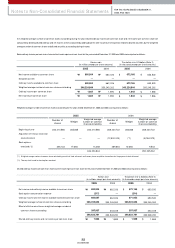
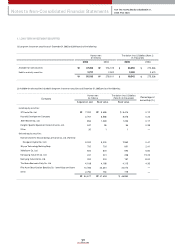
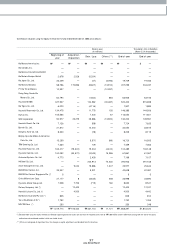
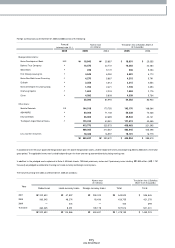
The changes in goodw ill or negative goodwill incurred from the equity securities of affiliates subject to equity method accounting for the year ended Decem ber 31,
2004 are as follow s :
Korean w on
(In millions)
Translation into U.S.dollars
(Note 2) (In thousands)
Beginning of year Increase Amortization End of year End of year
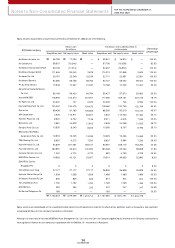
Dong Feng Yueda-Kia Motors Co., Ltd.
Hyundai MOBIS
Kia Tigers Co., Ltd.
Haevichi Resort Co., Ltd.
Beijing Hyundai Mobis Autom otive Parts Co., Ltd.
TRW Steering Co., Ltd.
Dymos Inc.
Hyundai Card Co., Ltd.
Donghui Auto Co., Ltd.
WIA Corporation
Bontek Co., Ltd.
Hyundai Hysco Co., Ltd.
EUKOR Car Carriers, Inc.
₩
₩
8,810 —2,436 6,374 6,292
9,763 —(3,673) 13,436 13,264
9,860 —3,944 5,916 5,840
887 —463 424 419
43 —934 34
1,887 —629 1,258 1,242
4,028 15,459 5,105 14,382 14,197
84,051 5,677 19,246 70,482 69,577
—100 40 60 59
(26,210) —(3,276) (22,934) (22,640)
(4,066) —(1,355) (2,711) (2,676)
(71,634) —(5,970) (65,664) (64,821)
(7,193) —(379) (6,814) (6,727)
10,226 21,236 17,219 14,243 14,060
₩
₩
₩
₩
₩
₩
$
$
Notes to Non-Consolidated Financial Statements FOR THE YEARS ENDED DECEMBER 31,
2005 AND 2004