Kia 2005 Annual Report Download - page 75
Download and view the complete annual report
Please find page 75 of the 2005 Kia annual report below. You can navigate through the pages in the report by either clicking on the pages listed below, or by using the keyword search tool below to find specific information within the annual report.-
 1
1 -
2
-
3
-
4
-
5
-
6
-
7
-
8
-
9
-
10
-
11
-
12
-
13
-
14
-
15
-
16
-
17
-
18
-
19
-
20
-
21
-
22
-
23
-
24
-
25
-
26
-
27
-
28
-
29
-
30
-
31
-
32
-
33
-
34
-
35
-
36
-
37
-
38
-
39
-
40
-
41
-
42
-
43
-
44
-
45
-
46
-
47
-
48
-
49
-
50
-
51
-
52
-
53
-
54
-
55
-
56
-
57
-
58
-
59
-
60
-
61
-
62
-
63
-
64
-
 65
65 -
 66
66 -
 67
67 -
 68
68 -
 69
69 -
 70
70 -
 71
71 -
 72
72 -
 73
73 -
 74
74 -
 75
75 -
 76
76 -
 77
77 -
 78
78 -
 79
79 -
 80
80 -
 81
81 -
 82
82 -
 83
83 -
 84
84 -
 85
85 -
86
-
87
-
88
-
89
-
90
-
91
-
92
-
93
-
94
-
95
-
96
-
97
-
98
-
99
-
100
-
101
-
102
-
103
-
104
-
105
-
106
-
107
-
108
-
109
-
110
-
111
-
112
-
113
-
114
-
115
-
116
-
117
-
118
-
119
-
120
-
121
-
122
-
123
-
124
-
125
-
126
-
127
-
128
 |
 |
75
2005 Annual Report
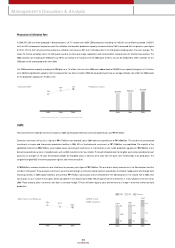
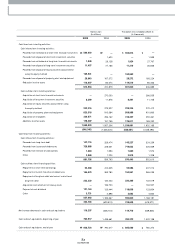
Fixed Assets
With regard to fixed assets, investm ents totaled ₩2,333 billion, an increase of ₩356 billion over 2004. We changed our evaluation m ethod for our INI Steel shares
from the market value method to the equity method, w hich resulted in a ₩228 billion of reduction in the book value of the long-term investm ent securities from
the previous year. Meanw hile, the application of the equity method allow ed us to realize total gains of ₩549 billion with regard to KIA’s stakes in Hyundai Mobis,
Wia, and Kia Motors Slovakia, etc (in which we had invested a certain or total sum of paid-in capital).
Tangible assets for 2005 am ounted to ₩5,233 billion, a ₩258 billion increase over the previous year; this resulted from investm ents relating to new vehicle
developm ents including new Pride, new Carnival, and Lotze, as w ell as investm ents in new engine and transm ission factories.
Intangible assets increased by ₩152 billion com pared to the previous year due to increases in capitalization of R&D expenses required for the roll-out of new
models such as new Carens and m id-large SUVs.
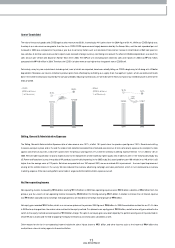
Liabilities
Current Liabilities
Despite the increase in the production and sales of com pletely built-up vehicles, the trade payables turnover period decreased slightly due to a increase in 100%
cash payment for material costs related to export vehicles; this means that the trade payables figure reached ₩1,969 billion, a sim ilar level to the previous year.
Short-term borrow ings w ere ₩313 billion, a ₩59 billion decrease from the previous year mainly due to a ₩50 billion reduction in com mercial paper issues. The
amount of current debentures and long-term borrow ings that matured in 2006 was ₩259 billion, a similar level to 2004. Other payables also decreased by
approxim ately ₩60 billion over the previous year; this resulted from low er incom e tax payable due to a reduction in 2005 taxable incom e, etc.
Non-current Liabilities
Total debentures rose by ₩515 billion over the previous year. This was m ainly due to the issue of 0.6 billion in corporate debentures and the reclassification of
debentures m aturing w ithin 1 year into the current debenture account. Approximately 116 million in foreign borrow ings were raised for the establishm ent of
overseas factories, but with the early repaym ent of ₩220 billion of the reorganized debts under court receivership and the valuation gains due to exchange rate
depreciation, etc, our long-term borrowings decreased by ₩102 billion com pared to 2004.
Despite the increase of units in operation (UIO) to keep up w ith increased sales volum e, short and long-term warranty provisions declined by ₩40 billion, which
reflected globally improved quality level of our products and the fall in foreign currency reserves, which takes up more than 80% of warranty provisions.
Equity
As of the end of 2005, total equity was ₩5,252 billion, an increase of ₩288 billion over the 2004 figure.
Retained earnings increased by ₩560 billion. And while net incom e was ₩681 billion, ₩121 billion was paid out in dividends to our shareholders. Capital
adjustm ents declined by ₩179 billion. There were tw o reasons for the decline in capital adjustm ents. First, the switch to the equity method with regard to our INI
Steel shares reduced the gains in the valuation of long-term investm ent by ₩91 billion. Second, the sw itch to the equity method led to lowering equity valuation
amount by ₩178 billion, resulting from Hyundai Motor Com pany and Hyundai Mobis shares held by INI Steel.
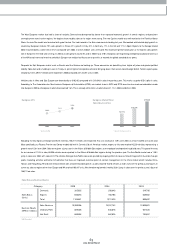
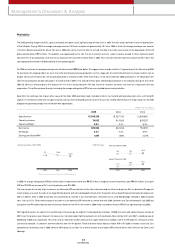
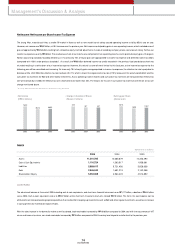
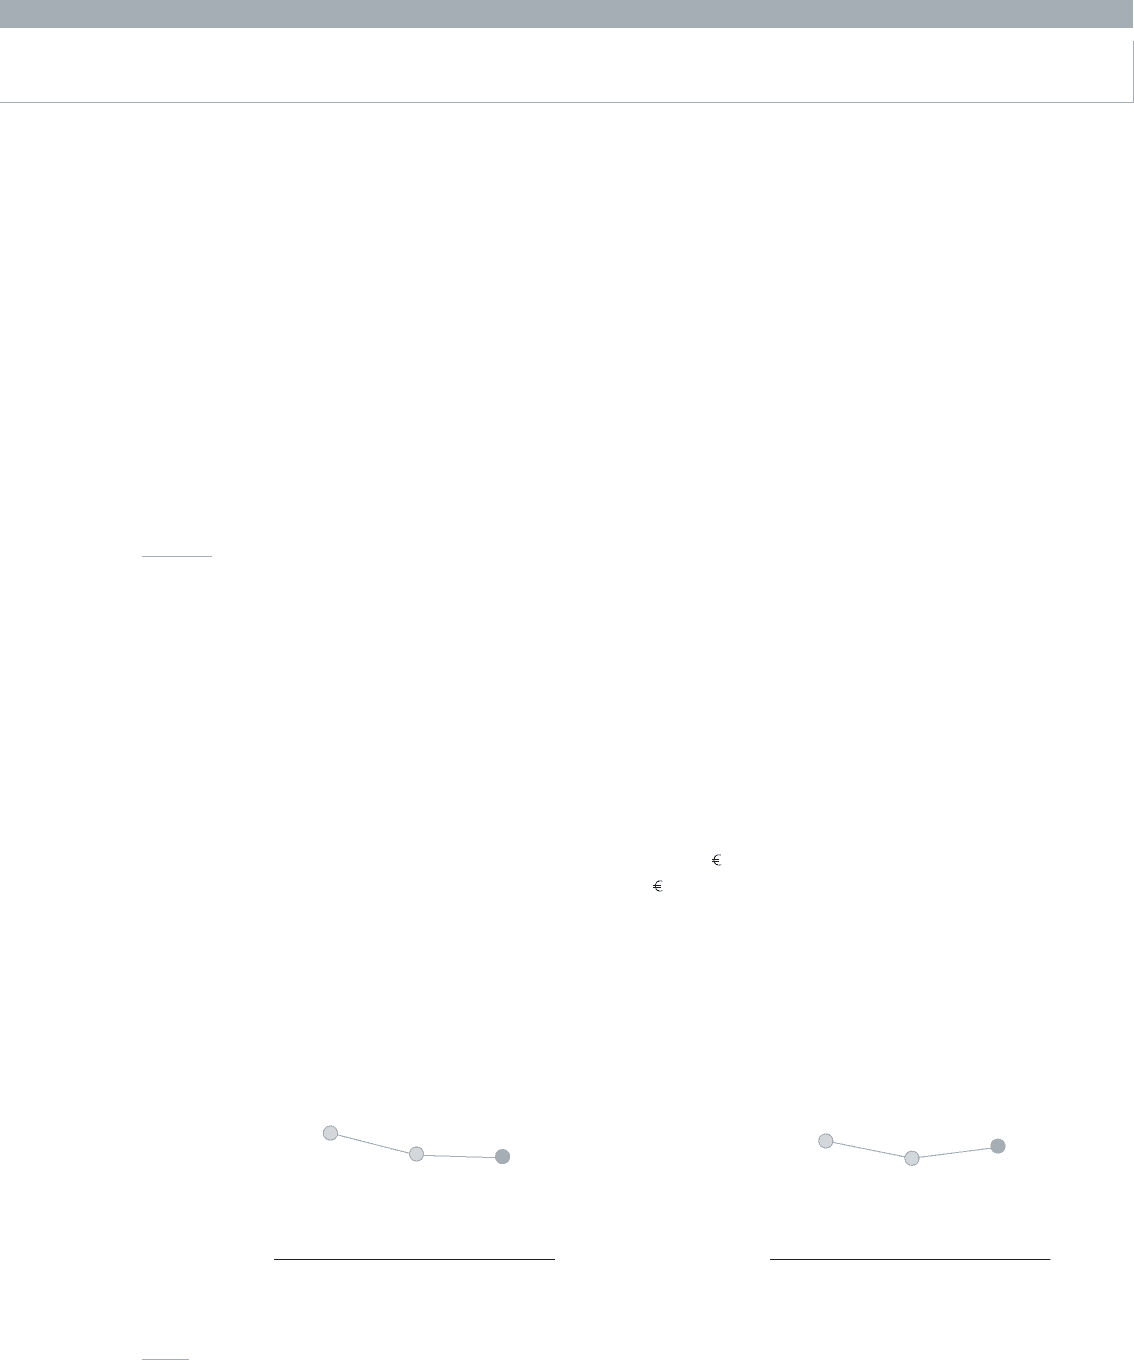
• Liability/Equity • Debt/ Total Assets
2003
129.1%
2004
115.2%
2005
114.0%
2003
20.7%
2004
15.8%
2005
18.2%