Kia 2005 Annual Report Download - page 74
Download and view the complete annual report
Please find page 74 of the 2005 Kia annual report below. You can navigate through the pages in the report by either clicking on the pages listed below, or by using the keyword search tool below to find specific information within the annual report.-
 1
1 -
2
-
3
-
4
-
5
-
6
-
7
-
8
-
9
-
10
-
11
-
12
-
13
-
14
-
15
-
16
-
17
-
18
-
19
-
20
-
21
-
22
-
23
-
24
-
25
-
26
-
27
-
28
-
29
-
30
-
31
-
32
-
33
-
34
-
35
-
36
-
37
-
38
-
39
-
40
-
41
-
42
-
43
-
44
-
45
-
46
-
47
-
48
-
49
-
50
-
51
-
52
-
53
-
54
-
55
-
56
-
57
-
58
-
59
-
60
-
61
-
62
-
63
-
 64
64 -
 65
65 -
 66
66 -
 67
67 -
 68
68 -
 69
69 -
 70
70 -
 71
71 -
 72
72 -
 73
73 -
 74
74 -
 75
75 -
 76
76 -
 77
77 -
 78
78 -
 79
79 -
 80
80 -
 81
81 -
 82
82 -
 83
83 -
 84
84 -
85
-
86
-
87
-
88
-
89
-
90
-
91
-
92
-
93
-
94
-
95
-
96
-
97
-
98
-
99
-
100
-
101
-
102
-
103
-
104
-
105
-
106
-
107
-
108
-
109
-
110
-
111
-
112
-
113
-
114
-
115
-
116
-
117
-
118
-
119
-
120
-
121
-
122
-
123
-
124
-
125
-
126
-
127
-
128
 |
 |
74
KIA MOTORS
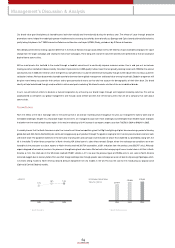
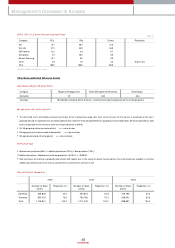
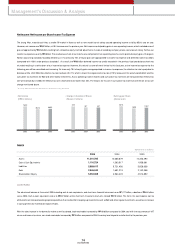
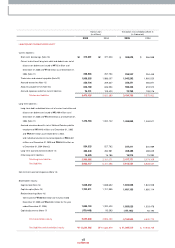
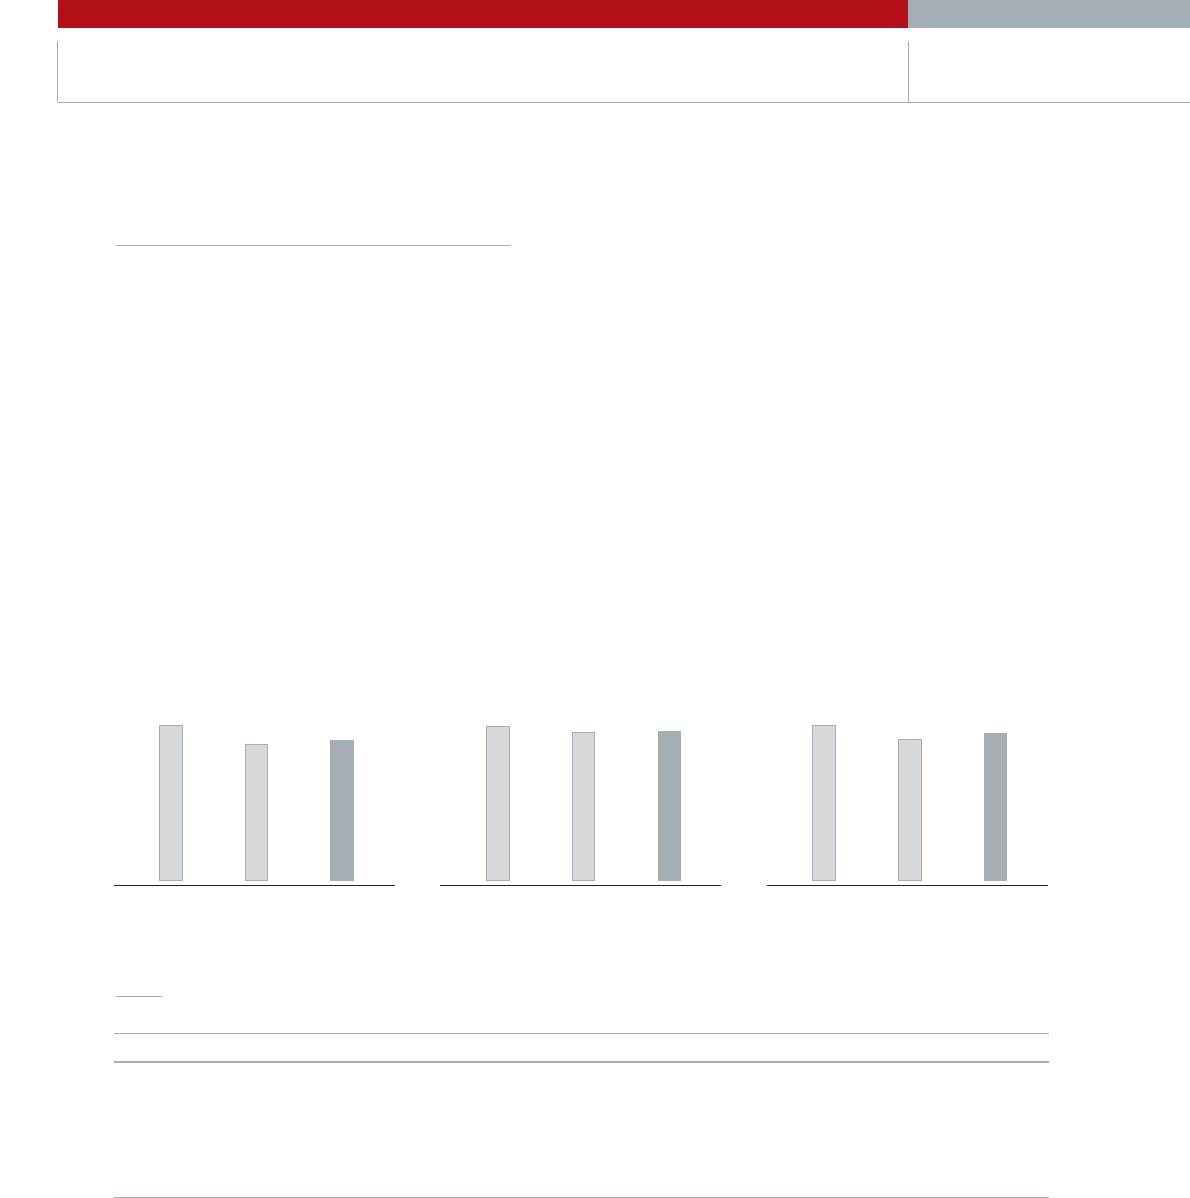
Net Income/ Net Income per Share/Income Tax Expense
The strong Won, material cost hikes, a sm aller RV m arket in Korea as well as new model launch delays caused operating incom e to fall by 85.6% year on year.
How ever, net incom e was ₩681 billion, a 2.8% increase over the previous year. Net incom e was helped by gains in non-operating incom e, which included one-off
gains of approximately ₩376 billion resulting from retroactive equity-m ethod adjustm ents, the sale of subsidiary com pany shares, and a lawsuit victory. Further, our
incom e tax expense w as only ₩8 billion. This was because m ost of our incom e was com prised of non-operating incom e, and in particular equity gains. Changes in
Korean accounting standards favorably affected us in this area; only 70% of equity gains are appropriated to incom e tax expense and deferred incom e tax debits
(com pared with 100% under previous standards)1. As a result, the ₩88 billion deferred incom e tax credits recorded in the previous fiscal year balance sheet w as
refunded resulting in a w rite dow n of our incom e tax expense. How ever, this refund is a one-off event lim ited to this fiscal year, so the incom e tax expense for the
follow ing year will be normalized and increasing. Yet since only 70% of equity gains are appropriated to income tax expenses, the effective tax rate is projected to
decrease a little. Until 2004, Kia's effective tax rate has been 20~ 21% which is low er than legal incom e tax rate (27.5%) because of the accum ulated deficit and the
cumulative tax incentives for R&D and other facility investm ents. As our operating incom e recovers and cum ulative tax incentives are exhausted, Kia's effective tax
rate w ill increase. But in 2006, the effective tax rate is estim ated to be low er than 20%. The reasons for this are (1) cum ulative tax incentives still remain (2) tax rule
change mentioned above.
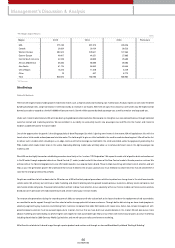
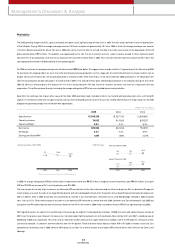
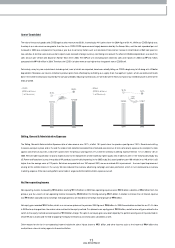
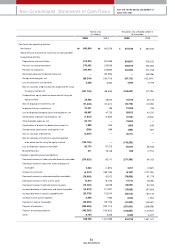
Current Assets
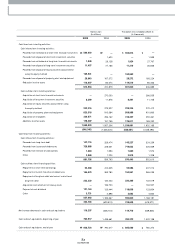
The actual cash balance at the end of 2005 including cash & cash equivalents, and short-term financial instrum ents was ₩1,117 billion, a decline of ₩444 billion
versus 2004. Cash & cash equivalents came to ₩907 billion w hile short-term financial instrum ents totaled ₩210 billion. The fall in the cash balance can be
attributed to an increased w orking capital expenditure that resulted from keeping up investm ents such as R&D and other regular investm ents, as w ell as an increase
in cash paym ents for materials for export vehicles.
With the sales increase in the dom estic market as well as abroad, trade receivables increased by ₩180 billion com pared to 2004, and with the occurrences of VAT
return and incom e tax return, non-trade receivables increased by ₩75 billion com pared to 2004. Inventory level stayed at a sim ilar level to the pervious year.
Management’s Discussion & Analysis
• Net Income
(KRW in billions)
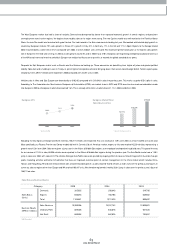
• Change in Number of Shares
(Shares in millions)
• Earnings per Share
(Korean won)
2003
2,078
2004
1,890
2005
1,967
2003 2004 20052003
752.9
2004
662.0
2005
680.9
359 347 347
11,241,785
1,116,724
5,989,417
2,046,040
5,252,368
2005 2004 2003
10,685,879
1,560,517
5,721,456
1,691,219
4,964,423
10,343,490
1,938,661
5,828,638
2,142,358
4,514,852
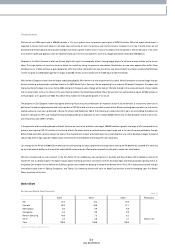
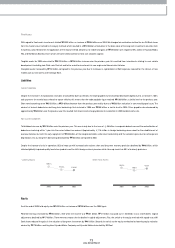
Assets
Cash & Cash Equivalents
Liabilities
Debt
Shareholders' Equity
(Korean w on in m illions)
Assets
1 set out by SKAS; the additional Statem ents of Korea Accounting Standards