Kia 2005 Annual Report Download - page 81
Download and view the complete annual report
Please find page 81 of the 2005 Kia annual report below. You can navigate through the pages in the report by either clicking on the pages listed below, or by using the keyword search tool below to find specific information within the annual report.-
 1
1 -
2
-
3
-
4
-
5
-
6
-
7
-
8
-
9
-
10
-
11
-
12
-
13
-
14
-
15
-
16
-
17
-
18
-
19
-
20
-
21
-
22
-
23
-
24
-
25
-
26
-
27
-
28
-
29
-
30
-
31
-
32
-
33
-
34
-
35
-
36
-
37
-
38
-
39
-
40
-
41
-
42
-
43
-
44
-
45
-
46
-
47
-
48
-
49
-
50
-
51
-
52
-
53
-
54
-
55
-
56
-
57
-
58
-
59
-
60
-
61
-
62
-
63
-
64
-
65
-
66
-
67
-
68
-
69
-
70
-
 71
71 -
 72
72 -
 73
73 -
 74
74 -
 75
75 -
 76
76 -
 77
77 -
 78
78 -
 79
79 -
 80
80 -
 81
81 -
 82
82 -
 83
83 -
 84
84 -
 85
85 -
 86
86 -
 87
87 -
 88
88 -
 89
89 -
 90
90 -
 91
91 -
92
-
93
-
94
-
95
-
96
-
97
-
98
-
99
-
100
-
101
-
102
-
103
-
104
-
105
-
106
-
107
-
108
-
109
-
110
-
111
-
112
-
113
-
114
-
115
-
116
-
117
-
118
-
119
-
120
-
121
-
122
-
123
-
124
-
125
-
126
-
127
-
128
 |
 |

81
2005 Annual Report
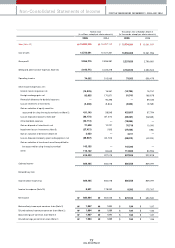
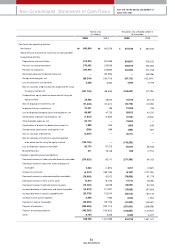
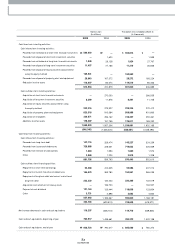
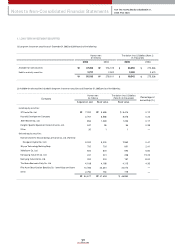
Non-Consolidated Statements of Cash Flows FOR THE YEARS ENDED DECEMBER 31,
2005 AND 2004
Korean w on
(In millions)
Translation into U.S.dollars (Note 2)
(In thousands)
2005 2004 2005 2004
Cash flow s from operating activities :
Net incom e
Adjustm ents to reconcile net incom e to net cash provided
by operating activities :
Depreciation and am ortization
Provision for severance benefits
Provision for warranties
Reversal of allow ance for doubtful accounts
Foreign exchange gain, net
Loss on retirem ent of inventories
Gain on valuation of equity securities accounted for using
the equity method, net
Dividend from equity securities accounted for using the
equity method
Gain on disposal of investm ents, net
Impairm ent loss on investm ents
Loss on disposal of property, plant and equipm ent, net
Am ortization of present value discount, net
Other bad debt expenses, net
Am ortization of discount on debentures issued, net
Com pensation expenses on stock options, net
Gain on valuation of derivatives
Gain on valuation of investm ent securities qualified
to be accounted for using the equity method
Loss on disposal of accounts receivable
Miscellaneous loss
Changes in operating assets and liabilities :
Decrease (increase) in trade notes and accounts receivable
Decrease (increase) in long-term notes and accounts
receivable
Increase in inventories
Decrease (increase) in advances and other receivables
Decrease (increase) in other current assets
Decrease (increase) in deferred incom e tax assets
Increase (decrease) in trade notes and accounts payable
Increase (decrease) in accounts payable-other
Increase in other current liabilities
Decrease in incom e tax payable
Paym ent of warranties
Paym ent of severance benefits
Other
680,904
612,815
270,082
245,440
—
(88,244)
5,008
(431,140)
34,460
(71,638)
27,421
89,967
(1,535)
20,112
1,889
(299)
(3,050)
(145,155)
86,173
211
(274,923)
3,243
(6,247)
(79,883)
15,914
(16,762)
(16,873)
(20,779)
8,408
(42,062)
(285,596)
(185,265)
6,164
438,760
₩662,026
524,969
229,526
318,860
(90,396)
(134,115)
5,844
(58,545)
28,500
(10,221)
185
40,723
(2,839)
—
643
589
—
—
57,270
18,148
85,117
(1,891)
(199,758)
92,972
(5,705)
63,825
311,807
152,074
1,982
(49,705)
(292,714)
(133,622)
6,306
1,621,855
672,166
604,951
266,616
242,290
—
(87,112)
4,944
(425,607)
34,018
(70,719)
27,069
88,812
(1,516)
19,854
1,865
(295)
(3,011)
(143,292)
85,067
208
(271,395)
3,201
(6,167)
(78,858)
15,710
(16,547)
(16,656)
(20,512)
8,300
(41,522)
(281,931)
(182,887)
6,085
433,129
653,530
518,232
226,580
314,768
(89,236)
(132,394 )
5,769
(57,794)
28,134
(10,090)
183
40,200
(2,802)
—
635
581
—
—
56,535
17,914
84,025
(1,867)
(197,194)
91,779
(5,633)
63,006
307,806
150,122
1,957
(49,067)
(288,958)
(131,907)
6,227
1,601,041
₩$ $