Kia 2005 Annual Report Download - page 17
Download and view the complete annual report
Please find page 17 of the 2005 Kia annual report below. You can navigate through the pages in the report by either clicking on the pages listed below, or by using the keyword search tool below to find specific information within the annual report.-
 1
1 -
2
-
3
-
4
-
5
-
6
-
 7
7 -
 8
8 -
 9
9 -
 10
10 -
 11
11 -
 12
12 -
 13
13 -
 14
14 -
 15
15 -
 16
16 -
 17
17 -
 18
18 -
 19
19 -
 20
20 -
 21
21 -
 22
22 -
 23
23 -
 24
24 -
 25
25 -
 26
26 -
 27
27 -
28
-
29
-
30
-
31
-
32
-
33
-
34
-
35
-
36
-
37
-
38
-
39
-
40
-
41
-
42
-
43
-
44
-
45
-
46
-
47
-
48
-
49
-
50
-
51
-
52
-
53
-
54
-
55
-
56
-
57
-
58
-
59
-
60
-
61
-
62
-
63
-
64
-
65
-
66
-
67
-
68
-
69
-
70
-
71
-
72
-
73
-
74
-
75
-
76
-
77
-
78
-
79
-
80
-
81
-
82
-
83
-
84
-
85
-
86
-
87
-
88
-
89
-
90
-
91
-
92
-
93
-
94
-
95
-
96
-
97
-
98
-
99
-
100
-
101
-
102
-
103
-
104
-
105
-
106
-
107
-
108
-
109
-
110
-
111
-
112
-
113
-
114
-
115
-
116
-
117
-
118
-
119
-
120
-
121
-
122
-
123
-
124
-
125
-
126
-
127
-
128
 |
 |

17
2005 Annual Report
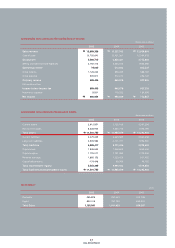
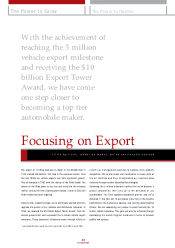
Domestic
Export
Total Sales
250,643
760,786
1,011,429
319,795
538,902
858,697
265,825
840,016
1,105,841
Sales revenue
Cost of sales
Gross profit
Selling and administrative expenses
Operating income
Other income
Other expense
Ordinary income
Extraordinary item
Income before income tax
Income tax expense
Net income
15,257,742
12,421,361
2,836,381
2,323,318
513,063
899,489
572,474
840,078
-
840,078
178,052
662,026
₩
₩
12,839,881
10,084,078
2,755,803
1,950,266
805,537
588,732
456,742
937,526
-
937,526
184,669
752,857
₩
₩
15,999,356
13,732,641
2,266,715
2,192,713
74,002
1,125,220
509,817
689,405
-
689,405
8,501
680,904
₩
₩
Current assets
Non-current assets
Total assets
Current liabilities
Long-term liabilities
Total liabilities
Capital stock
Capital surplus
Retained earnings
Capital adjustments
Total shareholders' equity
Total liabilities and shareholders' equity
3,122,169
7,563,710
10,685,879
3,620,385
2,101,071
5,721,456
1,848,652
1,701,955
1,320,423
93,393
4,964,423
10,685,879
₩
₩
3,251,294
7,092,196
10,343,490
3,834,658
1,993,980
5,828,638
1,848,652
1,700,956
921,452
43,792
4,514,852
10,343,490
₩
₩
2,912,851
8,328,934
11,241,785
3,479,435
2,509,982
5,989,417
1,848,652
1,703,011
1,880,153
-179,448
5,252,368
11,241,785
₩
₩
SUMMARIZED NON-CONSOLIDATED STATEMENTS OF INCOME
(Korean won in millions)
2005 2004 2003
SUMMARIZED NON-CONSOLIDATED BALANCE SHEETS
(Korean won in millions)
2005 2004 2003
SALES RESULT
(Units)
2005 2004 2003