Kia 2005 Annual Report Download - page 73
Download and view the complete annual report
Please find page 73 of the 2005 Kia annual report below. You can navigate through the pages in the report by either clicking on the pages listed below, or by using the keyword search tool below to find specific information within the annual report.-
 1
1 -
2
-
3
-
4
-
5
-
6
-
7
-
8
-
9
-
10
-
11
-
12
-
13
-
14
-
15
-
16
-
17
-
18
-
19
-
20
-
21
-
22
-
23
-
24
-
25
-
26
-
27
-
28
-
29
-
30
-
31
-
32
-
33
-
34
-
35
-
36
-
37
-
38
-
39
-
40
-
41
-
42
-
43
-
44
-
45
-
46
-
47
-
48
-
49
-
50
-
51
-
52
-
53
-
54
-
55
-
56
-
57
-
58
-
59
-
60
-
61
-
62
-
 63
63 -
 64
64 -
 65
65 -
 66
66 -
 67
67 -
 68
68 -
 69
69 -
 70
70 -
 71
71 -
 72
72 -
 73
73 -
 74
74 -
 75
75 -
 76
76 -
 77
77 -
 78
78 -
 79
79 -
 80
80 -
 81
81 -
 82
82 -
 83
83 -
84
-
85
-
86
-
87
-
88
-
89
-
90
-
91
-
92
-
93
-
94
-
95
-
96
-
97
-
98
-
99
-
100
-
101
-
102
-
103
-
104
-
105
-
106
-
107
-
108
-
109
-
110
-
111
-
112
-
113
-
114
-
115
-
116
-
117
-
118
-
119
-
120
-
121
-
122
-
123
-
124
-
125
-
126
-
127
-
128
 |
 |
73
2005 Annual Report
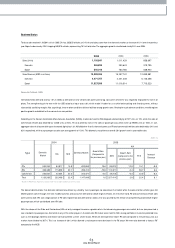
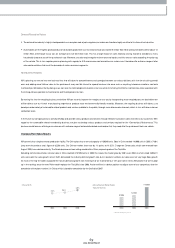
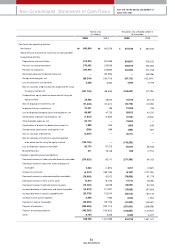
Cost of Goods Sold
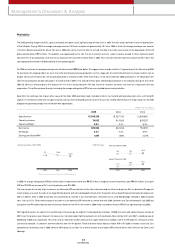
The ratio of the cost of goods sold (COGS) against sales revenue was 85.8%, increasing by 4.4% points from the 2004 figure of 81.4%. While our COGS slightly rose,
the drop in our sales revenue w as greater than the rise in COGS. COGS expenses were largely denominated by the Korean Won, and the cost expended per unit
increased in 2005 rose, com pared to the previous year, due to som e key factors such as material cost hikes and an increase in amortization of R&D cost spent on
new vehicles. In contrast, sales revenues from exports were received in foreign currency, and taking into account the effect of US dollar depreciation, as a result, the
sales amount per vehicle sold (based on Korean Won) fell in 2005. The ASP per unit (including both dom estic sales and exports) in 2005 was ₩13.3 million,
compared with ₩14.0 million in 2004. Therefore, the COGS % of sales revenue rose higher than the grow th rate of COGS itself.
Fortunately, many key raw material costs including steel, most of which are im ported, have been actually falling, so COGS is beginning to fall along w ith US dollar
depreciation. Moreover, we have an initiative to procure parts m ore effectively by revitalizing our supply chain management system , which we believe will knock
dow n the overall material costs incurred by the com pany. Besides reducing material costs, we will m ake all the efforts to im prove our COGS structure in all the other
fields of COGS.
• COGS
(KRW in billions,
% of Revenue)
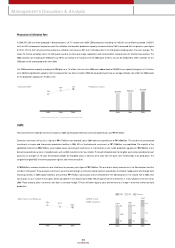
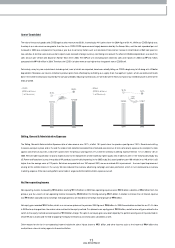
• SG&A
(KRW in billions,
% of Revenue)
81.4%
85.8%
2004 2005
+1,320.2
(10.6%)
12,412.4
13,732.6
-130.6
(-5.6%)
2,323.3 2,192.7
15.2% 13.7%
2004 2005
Selling, General & Administrative Expenses
The Selling, General & Adm inistrative Expenses ratio of sales revenue was 13.7%, a fall of 1.5% points from the previous year figure of 15.2%. Several cost-cutting
measures were put in place, and in the end the scale of cost reduction exceeded that of reduced sales revenue. In term s of warranty expense, for example, the ratio
against sales revenue was 2.0%, a fall of 0.7% points from the previous year figure of 2.7%, while the overseas marketing expense fell from 1.7% in 2004 to 1.0% in
2005. We were able to pare down warranty expenses due to the replacem ent of old models by higher quality new models. As seen in the 'Initial Quality Study’ (by
JD. Pow er and Associates) survey, the quality of KIA products is continually im proving. In the 2005 study, Kia’s score (problems per 100 vehicles) was 140, which is still
higher than the average score of 110 points. But when com pared w ith our 267 score of 2001, w e see a marked 48% im provem ent - the most rapid im provement
among all the vehicle makers in the survey. We also reduced the overseas advertising campaign and sales promotion, which in turn decreased our overseas
marketing expense. Other cost-saving efforts were made in w ages and other adm inistration expenses as w ell.
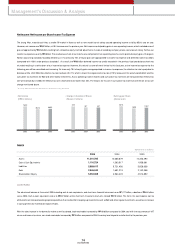
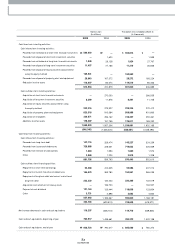
Net Non-operating Income
Non-operating incom e increased by ₩226 billion reaching ₩1,125 billion in 2005. Non-operating expenses w ere ₩510 billion, a decline of ₩62 billion from the
previous year. As a result, net non-operating incom e increased by ₩288 billion; the final figure being ₩615 billion. In relation to interest, the net interest expense
was ₩15 billion (accrued) and as to foreign exchange gain/ loss, we recorded a net foreign exchange gain of ₩96 billion.
Net equity gain recorded ₩431 billion, which is an im mense spike over the previous 2004 figure of ₩58 billion. In 2005 the evaluation m ethod for our 21.4% stake
in INI Steel was changed from the m arket value method to the equity method. This allow ed us an equity gain of ₩225 billion, and other one-off gains related to the
sw itch to the equity method accrued a positive ₩145 billion charge. The spike in net equity gains was also helped by the perform ance figures of Hyundai Card (in
which KIA ow ns shares) and the end of applying the equity method to our overseas sales subsidiaries as well.
Other reasons for the rise in non-operating incom e include the sale of Hysco shares at ₩51 billion, and other incom es such as the incom e of ₩64 billion that
resulted from a law suit victory against a financial institution.