Kia 2005 Annual Report Download - page 120
Download and view the complete annual report
Please find page 120 of the 2005 Kia annual report below. You can navigate through the pages in the report by either clicking on the pages listed below, or by using the keyword search tool below to find specific information within the annual report.-
 1
1 -
2
-
3
-
4
-
5
-
6
-
7
-
8
-
9
-
10
-
11
-
12
-
13
-
14
-
15
-
16
-
17
-
18
-
19
-
20
-
21
-
22
-
23
-
24
-
25
-
26
-
27
-
28
-
29
-
30
-
31
-
32
-
33
-
34
-
35
-
36
-
37
-
38
-
39
-
40
-
41
-
42
-
43
-
44
-
45
-
46
-
47
-
48
-
49
-
50
-
51
-
52
-
53
-
54
-
55
-
56
-
57
-
58
-
59
-
60
-
61
-
62
-
63
-
64
-
65
-
66
-
67
-
68
-
69
-
70
-
71
-
72
-
73
-
74
-
75
-
76
-
77
-
78
-
79
-
80
-
81
-
82
-
83
-
84
-
85
-
86
-
87
-
88
-
89
-
90
-
91
-
92
-
93
-
94
-
95
-
96
-
97
-
98
-
99
-
100
-
101
-
102
-
103
-
104
-
105
-
106
-
107
-
108
-
109
-
 110
110 -
 111
111 -
 112
112 -
 113
113 -
 114
114 -
 115
115 -
 116
116 -
 117
117 -
 118
118 -
 119
119 -
 120
120 -
 121
121 -
 122
122 -
 123
123 -
 124
124 -
 125
125 -
 126
126 -
 127
127 -
 128
128
 |
 |

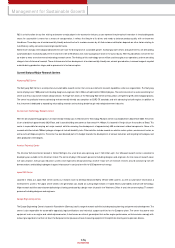
IR Information
120
KIA MOTORS
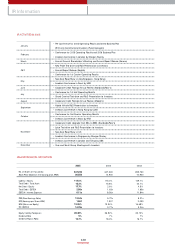
IR ACTIVITIES IN 2005
• Pre-Conference for 2005 Operating Results and 2006 Business Plan
With only Constitutional Investors (Fund-managers)
• Conference for 2005 Operating Results and 2006 Business Plan
• Investors Conference in London by M organ Stanley
• Annual General Shareholder's M eeting and Annual Report Release (Korean)
• New Pride Test-drive and R&D Presentation to Investors
• Annual Report Release (English)
• Conference for 1st Quarter Operating Results
• Non-Deal Road Show in Asia(Singapore, Hong Kong)
• Investors Conference in Seoul by UBS
• Corporate Credit Ratings Annual Review (Standard&Poor's)
• Conference for 1st Half Operating Results
• Grand Carnival Test-drive and R&D Presentation to Investors
• Corporate Credit Ratings Annual Review (Moody's)
• Hybrid Vehicle R&D Presentation to Investors
• Investors Conference in Hong Kong by CLSA
• Conference for 3rd Quarter Operating Results
• Investors Conference in Seoul by KRX
• Corporate Credit Upgrade from BB+ to BBB- (Standard&Poor's)
• Lotze Test-drive and R&D Presentation to Investors
• Non-Deal Road Show in US
• Investors Conference in Singapore by M organ Stanley
• Investors Conference in London and Tokyo by UBS
• Year-end Small Group M eetings w ith Investors
January
February
March
April
May
June
July
August
September
October
November
Decem ber
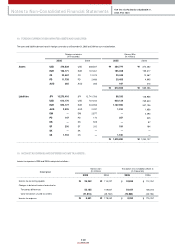
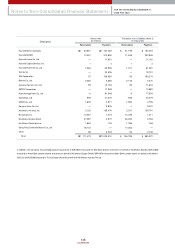
MAJOR FINANCIAL INDICATORS
347,230
26,550
114.0%
18.2%
17.7%
2.98x
6.11x
13.54x
1,961
12.96%
14.78x
28.28%
5%
12.7%
2005 2004 2003
347,230
10,900
115.2%
15.8%
2.6%
1.63x
8.56x
5.72x
1,907
13.34%
3.77x
36.52%
7%
18.3%
359,730
10,900
129.1%
20.7%
4.5%
1.68x
11.84x
5.21x
2,093
16.68%
3.24x
33.10%
7%
16.7%
No. of Shares (in thousands)
Stock Price (Based on the Closing price, KRW)
Liability / Equity
Total Debt / Total Asset
Net Debt / Equity
Total Debt / EBITDA
EBITDA / Interest Expense
PER (Price Earnings Ratio)
EPS (Earnings per Share, KRW)
ROE (Return on Equity)
EV / EBITDA
Equity held by Foreigners
Dividend Rate
Dividend Payout Ratio