Kia 2005 Annual Report Download - page 70
Download and view the complete annual report
Please find page 70 of the 2005 Kia annual report below. You can navigate through the pages in the report by either clicking on the pages listed below, or by using the keyword search tool below to find specific information within the annual report.-
 1
1 -
2
-
3
-
4
-
5
-
6
-
7
-
8
-
9
-
10
-
11
-
12
-
13
-
14
-
15
-
16
-
17
-
18
-
19
-
20
-
21
-
22
-
23
-
24
-
25
-
26
-
27
-
28
-
29
-
30
-
31
-
32
-
33
-
34
-
35
-
36
-
37
-
38
-
39
-
40
-
41
-
42
-
43
-
44
-
45
-
46
-
47
-
48
-
49
-
50
-
51
-
52
-
53
-
54
-
55
-
56
-
57
-
58
-
59
-
 60
60 -
 61
61 -
 62
62 -
 63
63 -
 64
64 -
 65
65 -
 66
66 -
 67
67 -
 68
68 -
 69
69 -
 70
70 -
 71
71 -
 72
72 -
 73
73 -
 74
74 -
 75
75 -
 76
76 -
 77
77 -
 78
78 -
 79
79 -
 80
80 -
81
-
82
-
83
-
84
-
85
-
86
-
87
-
88
-
89
-
90
-
91
-
92
-
93
-
94
-
95
-
96
-
97
-
98
-
99
-
100
-
101
-
102
-
103
-
104
-
105
-
106
-
107
-
108
-
109
-
110
-
111
-
112
-
113
-
114
-
115
-
116
-
117
-
118
-
119
-
120
-
121
-
122
-
123
-
124
-
125
-
126
-
127
-
128
 |
 |
70
KIA MOTORS
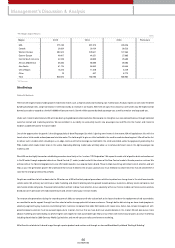
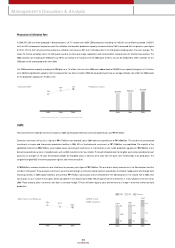
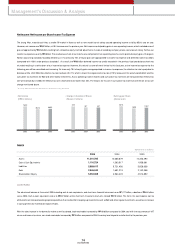
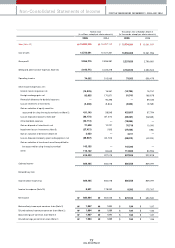
Production & Utilization Rate
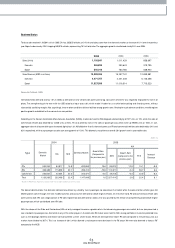
In 2005, 957,230 units were produced in dom estic plants, a 5.7% increase over 2004. OEM productions including the 148,201 units of Morning totaled 1,105,431
units, an 8.4% increase over the previous year. Our utilization rate, based on production capacity, remained sim ilar at 76.6% com pared w ith the previous year’s figure
of 76.2%. For the first half year and last quarter our utilization rate was over 80%, but it fell below 60% in the 3rd quarter, bringing dow n the year’s average. The
reason for the low utilization rate in the 3rd quarter was due to strikes over wage negotiations and work condition im provements for contract base w orkers. The
2005 utilization rate including the OEM plant was 78.9%, an increase of 2.7% points over the 2004 figure of 76.2%; this can be attributed to a 99% utilization for the
OEM plant which started production from 2004.
Our 2005 production capacity including the OEM plant was 1.4 million units, but since 2006 we’ve added another 100,000 to our capacity, bringing it to 1.5 million
units. Additional production capacity is for the release of the new Carens model in 2006. We are projecting to have an average utilization rate of 86% for 2006, based
on the production capacity of 1.5 million units.
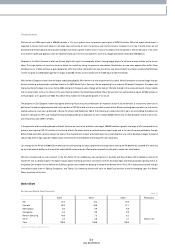
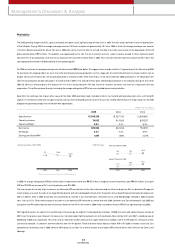
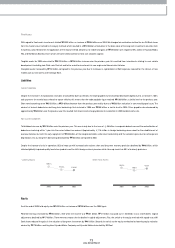
CapEx
The total investment expenditures of our com pany in 2005, covering both dom estic & overseas expenditures, w as ₩1,911billion.
Dom estic investm ents fell by 2.3%; a figure of ₩1,376billion was recorded, versus 2004 domestic expenditures of ₩1,409billion. This was due to concentrated
investments in engine and transm ission production facilities in 2004. 83% of total dom estic investm ent, or ₩1,140billion, was capitalized. The majority of the
capitalized investm ents (₩821billion) w ere tangible assets, consisting of investm ents in maintenance & new m odel production equipment. ₩319billion of our
dom estic expenditures w ere on intangible assets such as R&D investm ents for new m odels. The length of depreciation for tangible assets varies according to asset
types, but on average it is 15 years. Am ortization periods for intangible assets, in contrast, are 3 years from the point new models begin mass production. The
tangible/ intangible R&D investm ent proportion against sales revenue was 5.9%.
At ₩534billion, overseas investm ents rose 4-fold over the previous year’s figure of ₩122billion. This was due to heavy investm ents in the Slovakia plant and the
num ber 2 China plant. These overseas investm ents w ere financed through a m ixture of capital injections provided by the Korean headquarters and through local
financing overseas. In 2005 capital injections amounted to ₩171billion. Construction will be completed on the Slovakia plant in the second half of 2006. And
construction on our num ber 2 China plant will be completed in the second half of 2007. We will cap off further investm ents in a new US plant in the first half of
2009. These overseas plant investm ents will allow us to better hedge F/ X risks, will low er logistics costs and enhance our im age in these key markets by local
production.
Management’s Discussion & Analysis
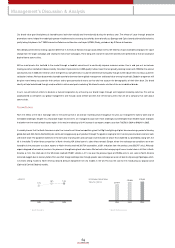
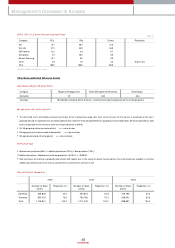
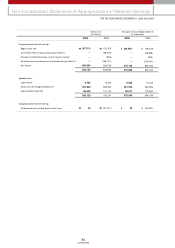
• R&D Trend (% of Revenue) • CAPEX Trend
(KRW in billions)
2003
7.9%
2004
6.7%
2005
5.9%
2003
45
2004
1,467 1,531
2005
1,911
1,009
413
1,027
122
382
534
949
428
R&DPP&E Overseas
• Utilization Rate • Production (Units)
* OEM Production(Picanto - Donghee Autom otive) Excluded
2003
74%
2004
76%
2005
77%
2003
852,598
2004
905,453
2005
957,230