Kia 2005 Annual Report Download - page 68
Download and view the complete annual report
Please find page 68 of the 2005 Kia annual report below. You can navigate through the pages in the report by either clicking on the pages listed below, or by using the keyword search tool below to find specific information within the annual report.-
 1
1 -
2
-
3
-
4
-
5
-
6
-
7
-
8
-
9
-
10
-
11
-
12
-
13
-
14
-
15
-
16
-
17
-
18
-
19
-
20
-
21
-
22
-
23
-
24
-
25
-
26
-
27
-
28
-
29
-
30
-
31
-
32
-
33
-
34
-
35
-
36
-
37
-
38
-
39
-
40
-
41
-
42
-
43
-
44
-
45
-
46
-
47
-
48
-
49
-
50
-
51
-
52
-
53
-
54
-
55
-
56
-
57
-
 58
58 -
 59
59 -
 60
60 -
 61
61 -
 62
62 -
 63
63 -
 64
64 -
 65
65 -
 66
66 -
 67
67 -
 68
68 -
 69
69 -
 70
70 -
 71
71 -
 72
72 -
 73
73 -
 74
74 -
 75
75 -
 76
76 -
 77
77 -
 78
78 -
79
-
80
-
81
-
82
-
83
-
84
-
85
-
86
-
87
-
88
-
89
-
90
-
91
-
92
-
93
-
94
-
95
-
96
-
97
-
98
-
99
-
100
-
101
-
102
-
103
-
104
-
105
-
106
-
107
-
108
-
109
-
110
-
111
-
112
-
113
-
114
-
115
-
116
-
117
-
118
-
119
-
120
-
121
-
122
-
123
-
124
-
125
-
126
-
127
-
128
 |
 |

68
KIA MOTORS
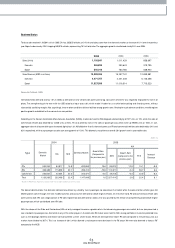
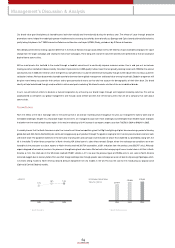
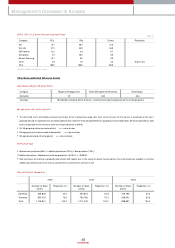
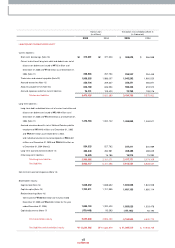
2005 (1.1.05~31.12) Market Share per Automobile Type
Management’s Discussion & Analysis
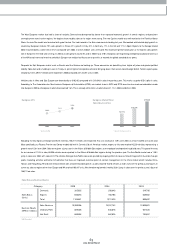
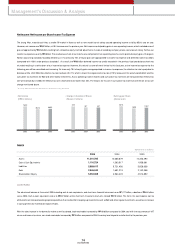
Domestic & Export Composition
2005
Number of Sales
(Units)
Proportion (% ) Number of Sales
(Units)
Proportion (% ) Number of Sales
(Units)
Proportion (% )
2004 2003
Category PCs RVs Others Particulars
KIA 15.1 38.7 22.0
Hyundai 47.3 36.9 66.0
GM Daewoo 13.2 2.0 8.7
Ssangyong 2.3 20.6 0.0
Renault Sam sung 18.1 0.0 0.0
Other 4.0 1.8 3.3 Imports etc.
Total 100.0 100.0 100.0
(Unit: %)
*Based on the KAMA new registrations data
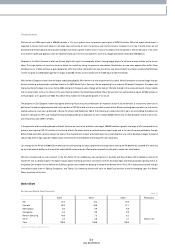
Other Business Related Reference Details
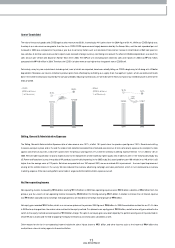
Major Business Regions (Strategic Points)
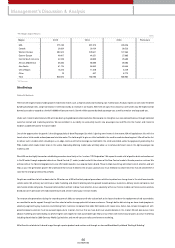
Sex, age group, and income segments
▶The continued rise in autom obile purchases by fem ales & their increased car usage rates (even when they are not the ow ners or purchasers of the car) is
gradually diluting the significance of sex related segm entation. How ever there are large differences according to autom obile types. We have organized our sales
teams to specialize within one of our three m ain incom e brackets, as follow s
▶30~ 40 age group (active econom ic activity) >> > mid-end sales
▶50s age group (m ost economically stable period) >>> high-end sales
▶20s age group(w eak purchasing power) > >> Low -end sales
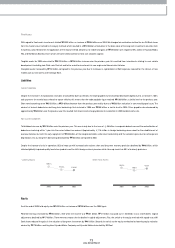
Per Purchase Type
▶Replacem ent purchases (65.4%) > Additional purchases (22.6%) > New purchases (12.0%)
Additional purchase + Replacem ent purchase proportion: `96 70.2% ⇒`05 88.0%
▶New purchases are show ing a gradually dow nw ard trend, largely due to the easing of special tax exemptions that were previously available; in contrast,
additional purchases continue to show an upward trend, as real incom es continue to rise.
Category Regional Headquarters Direct M anagement Branches Dealerships
Domestic 18 340 444
Overseas Worldw ide including North America ; overseas local sales companies as the strategic points
Domestic 265,825 24.0 250,643 24.8 319,795 37.2
Overseas 840,016 76.0 760,786 75.2 538,902 62.8
Total 1,105,841 100.0 1,011,429 100.0 858,697 100.0