Kia 2005 Annual Report Download - page 63
Download and view the complete annual report
Please find page 63 of the 2005 Kia annual report below. You can navigate through the pages in the report by either clicking on the pages listed below, or by using the keyword search tool below to find specific information within the annual report.-
 1
1 -
2
-
3
-
4
-
5
-
6
-
7
-
8
-
9
-
10
-
11
-
12
-
13
-
14
-
15
-
16
-
17
-
18
-
19
-
20
-
21
-
22
-
23
-
24
-
25
-
26
-
27
-
28
-
29
-
30
-
31
-
32
-
33
-
34
-
35
-
36
-
37
-
38
-
39
-
40
-
41
-
42
-
43
-
44
-
45
-
46
-
47
-
48
-
49
-
50
-
51
-
52
-
 53
53 -
 54
54 -
 55
55 -
 56
56 -
 57
57 -
 58
58 -
 59
59 -
 60
60 -
 61
61 -
 62
62 -
 63
63 -
 64
64 -
 65
65 -
 66
66 -
 67
67 -
 68
68 -
 69
69 -
 70
70 -
 71
71 -
 72
72 -
 73
73 -
74
-
75
-
76
-
77
-
78
-
79
-
80
-
81
-
82
-
83
-
84
-
85
-
86
-
87
-
88
-
89
-
90
-
91
-
92
-
93
-
94
-
95
-
96
-
97
-
98
-
99
-
100
-
101
-
102
-
103
-
104
-
105
-
106
-
107
-
108
-
109
-
110
-
111
-
112
-
113
-
114
-
115
-
116
-
117
-
118
-
119
-
120
-
121
-
122
-
123
-
124
-
125
-
126
-
127
-
128
 |
 |

63
2005 Annual Report
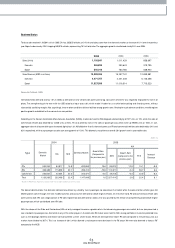
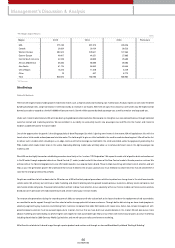
Business Status
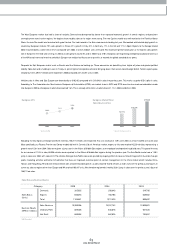
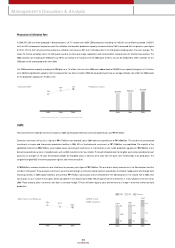
Total car sales reached 1,105,841 units in 2005. Of that, 265,825 vehicles, or 24% of total sales, came from the dom estic market, an increase of 6.1% over the previous
year. Exports sales rose by 10.4% topping 840,016 vehicles, representing 76% of total sales. The aggregate grow th rate clim bed sturdy 9.3% over 2004.
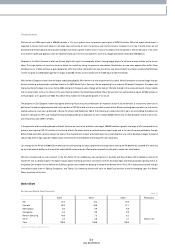
Domestic Outlook - 2005
Overall dom estic dem and rose by 1.6% in 2005, as dem and for new vehicle sales continued to lag. Consum er sentim ent was negatively im pacted the rise in oil
prices. The strengthening of the won with the USD raised our input costs a bit, which made it harder for us to offer better pricing and financing terms, without
substantially sacrificing margins. Not surprisingly, these m arket conditions did not facilitate strong grow th rates. Yet despite such adverse conditions, we did register
positive grow th and did better than som e of our com petitors.
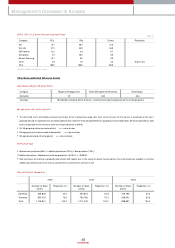
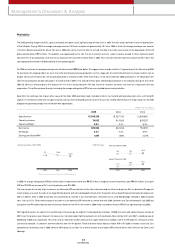
According to the Korean Autom obile Manufacturers Association (KAMA), m arket dem and for RVs dropped substantially by 67,977 units, or 19%, while the sales of
commercial vehicles also declined by 13,230 units, or 5.6%. This was offset by rises in the sales of passenger cars, w hich w ere up 99,595 units or 18.6%. In sum ,
aggregate sales of all autom obile types increased slightly by 1.6%. KIA did better than its domestic peers; our RV and com mercial vehicles sales declined by 2.4% and
6.3% respectively, while our passenger car sales saw strong grow th of 12.9%. This allow ed us to achieve an overall 2.0% grow th rate in autom obile sales.
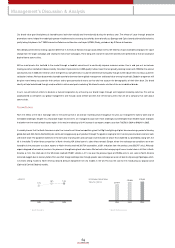
The above table illustrates that dom estic dem and was driven by a healthy rise in passenger car sales drove the market while the sales of other vehicle types fell.
Market grow th came through the new models launches and consum er demand for diesel engine vehicles. On the other hand, RV and com mercial vehicle sales
continued to slide. We saw a large portion of RV sales migrate tow ards dem and for sedans; this w as spurred by the release of competitively priced diesel engine
passenger cars, which cannibalized som e RV sales.
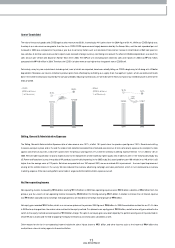
With the release of the Pride and Cerato diesel, KIA not only managed to secure a greater role in the blossom ing passenger cars m arket, but w e also presented a
new standard in passenger cars. And while many of the other players in the dom estic RV market were hard hit, KIA’s strong portfolio of custom er preferred lines
such as the Sportage, Sorento and Grand Carnival buffered us from severe losses. While we did experience low er RV sales com pared to the previous year, our
market share clim bed to 38.7%. This is an increase of 6.6%, which allowed us to becom e more dom inant in the RV sector. We were also deem ed a “famous RV”
company by the NCSI.
1,105,841
265,825
840,016
15,999,356
4,471,757
11,527,599
2005
2004 2003
1,011,429
250,643
760,786
15,257,742
4,241,228
11,016,514
858,697
319,795
538,902
12,839,881
5,126,358
7,713,523
Sales (Units)
Domestic
Export
Sales Revenue (KRW in millions)
Domestic
Export
Domestic Market
633,859
290,412
223,377
1,147,648
20052004
534,264
358,389
236,607
1,129,260
PCs
RVs
Commercial
Total
84,917
115,039
52,504
252,460
Growth Rate
(Compared to
the previous year)
18.6
-19.0
-5.6
1.6
Sales
95,875
112,321
49,218
257,414
Growth Rate
(Compared to the
previous year)
12.9
-2.4
-6.3
2.0
KIA
M/S
15.1
38.7
22.0
22.4
Increase/
Decrease
-0.8
6.6
-0.2
0.1
15.9
32.1
22.2
22.4
* Based on KAMA new registrations data; there may be slight differences with our data
(Unit, %)
Domestic
Market KIA M/S
Type