JetBlue Airlines 2011 Annual Report Download - page 94
Download and view the complete annual report
Please find page 94 of the 2011 JetBlue Airlines annual report below. You can navigate through the pages in the report by either clicking on the pages listed below, or by using the keyword search tool below to find specific information within the annual report.-
 1
1 -
2
-
3
-
4
-
5
-
6
-
7
-
8
-
9
-
10
-
11
-
12
-
13
-
14
-
15
-
16
-
17
-
18
-
19
-
20
-
21
-
22
-
23
-
24
-
25
-
26
-
27
-
28
-
29
-
30
-
31
-
32
-
33
-
34
-
35
-
36
-
37
-
38
-
39
-
40
-
41
-
42
-
43
-
44
-
45
-
46
-
47
-
48
-
49
-
50
-
51
-
52
-
53
-
54
-
55
-
56
-
57
-
58
-
59
-
60
-
61
-
62
-
63
-
64
-
65
-
66
-
67
-
68
-
69
-
70
-
71
-
72
-
73
-
74
-
75
-
76
-
77
-
78
-
79
-
80
-
81
-
82
-
83
-
 84
84 -
 85
85 -
 86
86 -
 87
87 -
 88
88 -
 89
89 -
 90
90 -
 91
91 -
 92
92 -
 93
93 -
 94
94 -
 95
95 -
 96
96 -
 97
97 -
 98
98 -
 99
99 -
 100
100 -
 101
101 -
 102
102 -
 103
103 -
 104
104 -
105
-
106
-
107
-
108
-
109
-
110
-
111
-
112
-
113
-
114
-
115
-
116
-
117
-
118
-
119
-
120
-
121
-
122
-
123
-
124
-
125
-
126
-
127
-
128
-
129
-
130
-
131
 |
 |

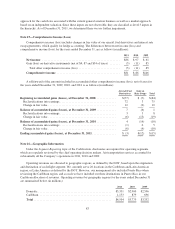
Our tangible assets primarily consist of our fleet of aircraft, which is deployed system wide, with no
individual aircraft dedicated to any specific route or region; therefore our assets do not require any allocation to a
geographic area.
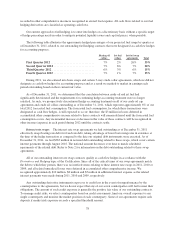
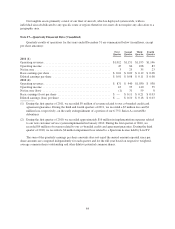
Note 17—Quarterly Financial Data (Unaudited)
Quarterly results of operations for the years ended December 31 are summarized below (in millions, except
per share amounts):
First
Quarter
Second
Quarter
Third
Quarter
Fourth
Quarter
2011 (1)
Operating revenues ............................................. $1,012 $1,151 $1,195 $1,146
Operating income .............................................. 45 86 108 83
Net income ................................................... 3 25 35 23
Basic earnings per share ......................................... $ 0.01 $ 0.09 $ 0.12 $ 0.08
Diluted earnings per share ....................................... $ 0.01 $ 0.08 $ 0.11 $ 0.08
2010 (2)
Operating revenues ............................................. $ 871 $ 940 $1,030 $ 938
Operating income .............................................. 43 95 140 55
Net income (loss) .............................................. (1) 31 59 8
Basic earnings (loss) per share .................................... $ — $ 0.11 $ 0.21 $ 0.03
Diluted earnings (loss) per share .................................. $ — $ 0.10 $ 0.18 $ 0.03
(1) During the first quarter of 2011, we recorded $9 million of revenue related to our co-branded credit card
agreement guarantee. During the third and fourth quarters of 2011, we recorded a $5 million loss and $1
million loss, respectively, on the early extinguishment of a portion of our 6.75% Series A convertible
debentures
(2) During the first quarter of 2010, we recorded approximately $16 million in implementation expenses related
to our new customer service system implemented in January 2010. During the first quarter of 2010, we
recorded $4 million of revenue related to our co-branded credit card agreement guarantee. During the third
quarter of 2010, we recorded a $6 million impairment loss related to a Spectrum license held by LiveTV.
The sum of the quarterly earnings per share amounts does not equal the annual amount reported since per
share amounts are computed independently for each quarter and for the full year based on respective weighted-
average common shares outstanding and other dilutive potential common shares.
84