JetBlue Airlines 2011 Annual Report Download - page 48
Download and view the complete annual report
Please find page 48 of the 2011 JetBlue Airlines annual report below. You can navigate through the pages in the report by either clicking on the pages listed below, or by using the keyword search tool below to find specific information within the annual report.-
 1
1 -
2
-
3
-
4
-
5
-
6
-
7
-
8
-
9
-
10
-
11
-
12
-
13
-
14
-
15
-
16
-
17
-
18
-
19
-
20
-
21
-
22
-
23
-
24
-
25
-
26
-
27
-
28
-
29
-
30
-
31
-
32
-
33
-
34
-
35
-
36
-
37
-
 38
38 -
 39
39 -
 40
40 -
 41
41 -
 42
42 -
 43
43 -
 44
44 -
 45
45 -
 46
46 -
 47
47 -
 48
48 -
 49
49 -
 50
50 -
 51
51 -
 52
52 -
 53
53 -
 54
54 -
 55
55 -
 56
56 -
 57
57 -
 58
58 -
59
-
60
-
61
-
62
-
63
-
64
-
65
-
66
-
67
-
68
-
69
-
70
-
71
-
72
-
73
-
74
-
75
-
76
-
77
-
78
-
79
-
80
-
81
-
82
-
83
-
84
-
85
-
86
-
87
-
88
-
89
-
90
-
91
-
92
-
93
-
94
-
95
-
96
-
97
-
98
-
99
-
100
-
101
-
102
-
103
-
104
-
105
-
106
-
107
-
108
-
109
-
110
-
111
-
112
-
113
-
114
-
115
-
116
-
117
-
118
-
119
-
120
-
121
-
122
-
123
-
124
-
125
-
126
-
127
-
128
-
129
-
130
-
131
 |
 |
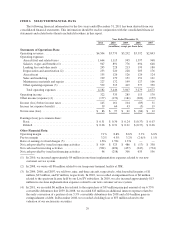
Interest income and other decreased $7 million primarily due to $6 million in losses on the early
extinguishment of $39 million par value of our 6.75% Series A convertible debt due 2039. Accounting
ineffectiveness on crude, heating oil and jet fuel derivatives classified as cash flow hedges resulted in losses of
$2 million in each of 2011 and in 2010. We are unable to predict what the amount of ineffectiveness will be
related to these instruments, or the potential loss of hedge accounting which is determined on a
derivative-by-derivative basis, due to the volatility in the forward markets for these commodities.
Our effective tax rate was 41% in 2011 compared to 40% in 2010. Our effective tax rate differs from the
statutory income tax rate primarily due to state income taxes, the change in valuation allowance and the
non-deductibility of certain items for tax purposes and the relative size of these items to our pre-tax income of
$145 million in 2011 and pre-tax income of $161 million in 2010. The rate increase was due to a reduction in the
valuation allowance attributable to state net operating loss carryforwards in 2010.
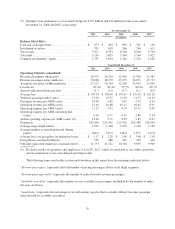
Year 2010 Compared to Year 2009
We reported net income of $97 million in 2010 compared to net income of $61 million in 2009. In 2010, we
had operating income of $333 million, an increase of $48 million over 2009, and an operating margin of 8.8%, up
0.2 points from 2009. Diluted earnings per share were $0.31 for 2010 compared to diluted earnings per share of
$0.21 for 2009.
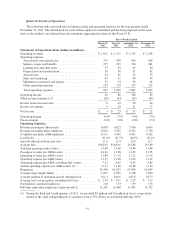
Operating Revenues. Operating revenues increased 15%, or $487 million, primarily due to a 16% increase
in passenger revenues. The $478 million increase in passenger revenues was attributable to a 7% increase in
capacity with a 7% increase in yield and a 1.7 point increase in load factor over 2009, amounts which include
capacity reductions during the initial cutover period to our new customer service system in the first quarter of
2010. Included in this amount is a $14 million increase in Even More Legroom revenue as a result of increased
capacity and revised pricing.
Other revenues increased 3%, or $9 million, primarily due to a $10 million increase in marketing related
revenues, higher excess baggage revenue of $4 million and increased rates for certain ancillary services during
2010. Other revenue also increased $3 million due to higher inflight food and beverage sales, but was offset by a
$10 million reduction in change fees and reservation fees as a result of high levels of change fee waivers during
the first half of 2010 in conjunction with our new system migration.
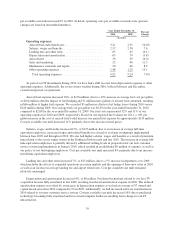
Operating Expenses. Operating expenses increased 15%, or $439 million, primarily due to higher fuel
prices and an increase in other operating expenses, including the one-time implementation related expenses of
our new customer service system, overall higher technology infrastructure costs, and a one-time impairment
charge. Additionally, operating expenses increased due to higher salaries, wages and benefits related to pilot pay
increases implemented in mid-2009, increased sales and marketing expenses due to higher fares and increased
GDS participation, and increased maintenance and variable costs. We had on average five additional average
aircraft in service in 2010 and operating capacity increased approximately 7% to 34.74 billion available seat
miles in 2010. Operating expenses per available seat mile increased 7% to 9.92 cents. Excluding fuel, our cost
38