JetBlue Airlines 2011 Annual Report Download - page 52
Download and view the complete annual report
Please find page 52 of the 2011 JetBlue Airlines annual report below. You can navigate through the pages in the report by either clicking on the pages listed below, or by using the keyword search tool below to find specific information within the annual report.-
 1
1 -
2
-
3
-
4
-
5
-
6
-
7
-
8
-
9
-
10
-
11
-
12
-
13
-
14
-
15
-
16
-
17
-
18
-
19
-
20
-
21
-
22
-
23
-
24
-
25
-
26
-
27
-
28
-
29
-
30
-
31
-
32
-
33
-
34
-
35
-
36
-
37
-
38
-
39
-
40
-
41
-
 42
42 -
 43
43 -
 44
44 -
 45
45 -
 46
46 -
 47
47 -
 48
48 -
 49
49 -
 50
50 -
 51
51 -
 52
52 -
 53
53 -
 54
54 -
 55
55 -
 56
56 -
 57
57 -
 58
58 -
 59
59 -
 60
60 -
 61
61 -
 62
62 -
63
-
64
-
65
-
66
-
67
-
68
-
69
-
70
-
71
-
72
-
73
-
74
-
75
-
76
-
77
-
78
-
79
-
80
-
81
-
82
-
83
-
84
-
85
-
86
-
87
-
88
-
89
-
90
-
91
-
92
-
93
-
94
-
95
-
96
-
97
-
98
-
99
-
100
-
101
-
102
-
103
-
104
-
105
-
106
-
107
-
108
-
109
-
110
-
111
-
112
-
113
-
114
-
115
-
116
-
117
-
118
-
119
-
120
-
121
-
122
-
123
-
124
-
125
-
126
-
127
-
128
-
129
-
130
-
131
 |
 |
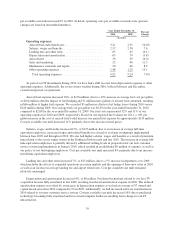
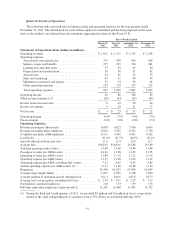
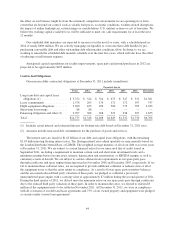
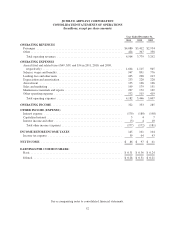
(2) Excludes results of operations and employees of LiveTV, LLC, which are unrelated to our airline operations
and are immaterial to our consolidated operating results.
Although we experienced significant revenue growth in 2011, this trend may not continue. We expect our
expenses to continue to increase significantly as we acquire additional aircraft, as our fleet ages and as we
expand the frequency of flights in existing markets and enter into new markets. Accordingly, the comparison of
the financial data for the quarterly periods presented may not be meaningful. In addition, we expect our operating
results to fluctuate significantly from quarter-to-quarter in the future as a result of various factors, many of which
are outside our control. Consequently, we believe that quarter-to-quarter comparisons of our operating results
may not necessarily be meaningful and you should not rely on our results for any one quarter as an indication of
our future performance.
Liquidity and Capital Resources
Our business is capital intensive. Our ability to successfully implement our strategy is dependent on the
continued availability of capital on attractive terms. In addition, our ability to successfully operate our business is
dependent on maintaining sufficient liquidity. We believe that we have adequate resources from a combination of
cash and cash equivalents on hand and cash expected to be generated from future operations to continue to meet
our obligations as they become due.
At December 31, 2011, we had cash and cash equivalents of $673 million and short-term investments of
$553 million, as compared to cash and cash equivalents of $465 million and short-term investments of $495
million at December 31, 2010. We also had $38 million of long-term investments at December 31, 2011
compared to $133 million at December 31, 2010. Cash flows provided by operating activities totaled $614
million in 2011 compared to $523 million in 2010 and $486 million in 2009. The $91 million increase in cash
flows from operations in 2011 compared to 2010 was primarily as a result of the 10% increase in average fares
and 7% increase in capacity, offset by 38% higher price of fuel. The $37 million increase in cash flows from
operations in 2010 compared to 2009 was primarily a result of an 8% increase in average fares, 7% increase in
capacity and 1.7 point increase in load factor, offset by 10% higher price of fuel in 2010 compared to 2009. As of
December 31, 2011, our unrestricted cash, cash equivalents and short-term investments as a percentage of trailing
twelve months revenue was approximately 27%, which we believe is among the best in the industry. We rely
primarily on cash flows from operations, which we believe have increased significantly due to the execution of
our network strategy, to provide working capital for current and future operations.
Investing Activities. During 2011, capital expenditures related to our purchase of flight equipment
included $318 million for four Airbus A320 aircraft five EMBRAER 190 aircraft and nine spare engines,
$44 million for flight equipment deposits and $27 million for spare part purchases. Capital expenditures for other
property and equipment, including ground equipment purchases, facilities improvements and LiveTV inventory,
were $135 million. Investing activities in 2011 also included the net proceeds from the sale and maturities of $24
million in investment securities.
During 2010, capital expenditures related to our purchase of flight equipment included $142 million for four
aircraft and five spare engines, $50 million for flight equipment deposits and $14 million for spare part
purchases. Capital expenditures for other property and equipment, including ground equipment purchases,
facilities improvements and LiveTV inventory, were $93 million. Investing activities in 2010 also included the
net purchase of $384 million in investment securities.
Financing Activities. Financing activities during 2011 consisted primarily of (1) the early extinguishment
of $39 million principal of our 6.75% Series A convertible debentures due 2039 for $45 million, (2) scheduled
maturities of $188 million of debt and capital lease obligations, (3) the early payment of $3 million on our spare
parts pass-through certificates, (4) our issuance of $121 million in fixed rate equipment notes and $124 million in
non-public floating rate equipment notes secured by four Airbus A320 aircraft and five EMBRAER 190 aircraft,
42