JetBlue Airlines 2011 Annual Report Download - page 125
Download and view the complete annual report
Please find page 125 of the 2011 JetBlue Airlines annual report below. You can navigate through the pages in the report by either clicking on the pages listed below, or by using the keyword search tool below to find specific information within the annual report.-
 1
1 -
2
-
3
-
4
-
5
-
6
-
7
-
8
-
9
-
10
-
11
-
12
-
13
-
14
-
15
-
16
-
17
-
18
-
19
-
20
-
21
-
22
-
23
-
24
-
25
-
26
-
27
-
28
-
29
-
30
-
31
-
32
-
33
-
34
-
35
-
36
-
37
-
38
-
39
-
40
-
41
-
42
-
43
-
44
-
45
-
46
-
47
-
48
-
49
-
50
-
51
-
52
-
53
-
54
-
55
-
56
-
57
-
58
-
59
-
60
-
61
-
62
-
63
-
64
-
65
-
66
-
67
-
68
-
69
-
70
-
71
-
72
-
73
-
74
-
75
-
76
-
77
-
78
-
79
-
80
-
81
-
82
-
83
-
84
-
85
-
86
-
87
-
88
-
89
-
90
-
91
-
92
-
93
-
94
-
95
-
96
-
97
-
98
-
99
-
100
-
101
-
102
-
103
-
104
-
105
-
106
-
107
-
108
-
109
-
110
-
111
-
112
-
113
-
114
-
 115
115 -
 116
116 -
 117
117 -
 118
118 -
 119
119 -
 120
120 -
 121
121 -
 122
122 -
 123
123 -
 124
124 -
 125
125 -
 126
126 -
 127
127 -
 128
128 -
 129
129 -
 130
130 -
 131
131
 |
 |

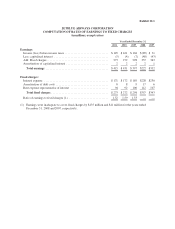
Exhibit 12.1
JETBLUE AIRWAYS CORPORATION
COMPUTATION OF RATIO OF EARNINGS TO FIXED CHARGES
(in millions, except ratios)
Year Ended December 31,
2011 2010 2009 2008 2007
Earnings:
Income (loss) before income taxes .............................. $145 $161 $104 $(89) $ 31
Less: capitalized interest ..................................... (5) (4) (7) (48) (43)
Add: Fixed charges .......................................... 273 272 298 357 343
Amortization of capitalized interest .............................22221
Total earnings ........................................... $415 $431 $397 $222 $332
Fixed charges:
Interest expense ............................................ $171 $172 $189 $228 $230
Amortization of debt costs ....................................889176
Rent expense representative of interest .......................... 94 92 100 112 107
Total fixed charges ....................................... $273 $272 $298 $357 $343
Ratio of earnings to fixed charges (1) ........................... 1.52 1.59 1.33 — —
(1) Earnings were inadequate to cover fixed charges by $135 million and $11 million for the years ended
December 31, 2008 and 2007, respectively.