JetBlue Airlines 2011 Annual Report Download - page 41
Download and view the complete annual report
Please find page 41 of the 2011 JetBlue Airlines annual report below. You can navigate through the pages in the report by either clicking on the pages listed below, or by using the keyword search tool below to find specific information within the annual report.-
 1
1 -
2
-
3
-
4
-
5
-
6
-
7
-
8
-
9
-
10
-
11
-
12
-
13
-
14
-
15
-
16
-
17
-
18
-
19
-
20
-
21
-
22
-
23
-
24
-
25
-
26
-
27
-
28
-
29
-
30
-
 31
31 -
 32
32 -
 33
33 -
 34
34 -
 35
35 -
 36
36 -
 37
37 -
 38
38 -
 39
39 -
 40
40 -
 41
41 -
 42
42 -
 43
43 -
 44
44 -
 45
45 -
 46
46 -
 47
47 -
 48
48 -
 49
49 -
 50
50 -
 51
51 -
52
-
53
-
54
-
55
-
56
-
57
-
58
-
59
-
60
-
61
-
62
-
63
-
64
-
65
-
66
-
67
-
68
-
69
-
70
-
71
-
72
-
73
-
74
-
75
-
76
-
77
-
78
-
79
-
80
-
81
-
82
-
83
-
84
-
85
-
86
-
87
-
88
-
89
-
90
-
91
-
92
-
93
-
94
-
95
-
96
-
97
-
98
-
99
-
100
-
101
-
102
-
103
-
104
-
105
-
106
-
107
-
108
-
109
-
110
-
111
-
112
-
113
-
114
-
115
-
116
-
117
-
118
-
119
-
120
-
121
-
122
-
123
-
124
-
125
-
126
-
127
-
128
-
129
-
130
-
131
 |
 |
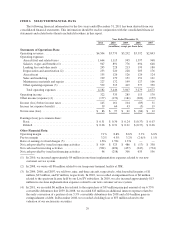
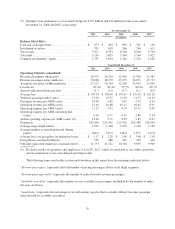
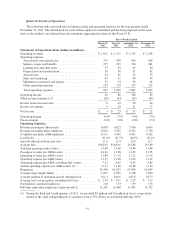
“Aircraft utilization” represents the average number of block hours operated per day per aircraft for the total fleet
of aircraft.
“Average fare” represents the average one-way fare paid per flight segment by a revenue passenger.
“Yield per passenger mile” represents the average amount one passenger pays to fly one mile.
“Passenger revenue per available seat mile” represents passenger revenue divided by available seat miles.
“Operating revenue per available seat mile” represents operating revenues divided by available seat miles.
“Operating expense per available seat mile” represents operating expenses divided by available seat miles.
“Operating expense per available seat mile, excluding fuel” represents operating expenses, less aircraft fuel,
divided by available seat miles.
“Average stage length” represents the average number of miles flown per flight.
“Average fuel cost per gallon” represents total aircraft fuel costs, including fuel taxes and effective portion of
fuel hedging, divided by the total number of fuel gallons consumed.
31